Excel Pivot Tables & Charts
A Step By Step Visual Guide
Excel 2016/2013
Practice Projects & Solutions Included for Beginners
By
A. J. Wright
Excel Pivot Tables & Charts
A Step By Step Visual Guide
Copyright 2018 A. J. Wright
All rights reserved. No part of this book may be reproduced, stored in a retrieval system, or transmitted in any form or by any means, without the prior written permission of the publisher, except in the case of brief quotations embedded in critical articles or reviews. Every effort has been made in the preparation of this book to ensure the accuracy of the information presented. However, the information contained in this book is sold without warranty, either express or implied. The author/publisher, its dealers and distributors will not be held liable for any damages caused or alleged to be caused directly or indirectly by this book. The author/publisher has endeavored to provide trademark information about all of the companies and products mentioned in this book. However, he cannot guarantee the accuracy of this information.
Microsoft, Excel and Word are registered trademarks or trademarks of Microsoft Corporation in the United States and/or other countries.
First published: February 2018
Table of Contents
How to Use This Book
Download Link for Exercise Files
Introduction to Pivot Tables
What is A Pivot Table?
Basic Concepts
Conditions to Create a Pivot Table
Limitations of a Pivot Table
Creating A Pivot Table
Source of Data
Structure of the Pivot Table
Creating Your First Pivot Table
Creating A Pivot Chart
How to Drill-Down Pivot Table Data
Adding More Rows (categories) to Pivot Table
How to Create A Pivot Table Chart
Slicers & Advanced Filtering
Timeline Slicer
Practice Project
Slicer
Additional Information
Advanced Filtering
Calculations in Pivot Tables
Calculated Fields
Practice Project
Adding A Basic Calculated Field
Removing Or Changing Calculated Fields
Inserting Logic Fields (if...then)
Customizing Pivot Tables
Making Major Cosmetic Changes
Making Minor Cosmetic Changes
Using VBA Macro Language to Create Pivot Tables
Introduction to VBA
Why Use Macros with Your Pivot Table Reports?
Recording Your First Macro
Using VBA to Create Pivot Tables
Visual Basic Editor
Visual Basic Tools
Understanding Object-Oriented Code
Writing Code to Handle Any Size Data Range
Using Super-Variables: Object Variables
Using With and End With to Shorten Code
Building a Pivot Table in Excel VBA
Practice Project
Adding Fields to the Data Area
8: Advanced Tips, Tricks & Techniques
How to Use This Book
This book can be used as a tutorial or quick reference visual guide. It is intended for users who are comfortable with the basics of Microsoft Excel and are now ready to build upon this skill by learning Pivot Tables and
This book assumes you already know how to create, open, save, and modify an Excel workbook and have a general familiarity with the Excel toolbar (Ribbon).
Most of the examples in this book use Microsoft Excel However, the functionality and formulas can be applied with Microsoft Excel version Although the screenshots in this book use Microsoft Excel 2016, functionality and display are not very much different if you are using Excel 2013.
Please always back-up your work and save often as we go. A good best practice when attempting any new functionality is to create a copy of the original spreadsheet and implement your changes on the copied spreadsheet. Should anything go wrong, you then have the original spreadsheet to fall back on.
Download Link for Exercise Files
The exercise files we will use later in this book are available for download at the following website:
Chapter 1: Introduction to Pivot Tables
Databases contain raw data on various topics, and are usually arranged in a tabular form. In many cases, data overload may make it difficult to use the information and convert it into relevant knowledge.
What is A Pivot Table?
A pivot table is a simple, yet powerful, technique which enables Excel users to turn the data overload into well-organized and meaningful knowledge.
By using a pivot table, users can perform various calculations on their data, such as calculating the average, counting, finding the minimum and the maximum values and so on.
Furthermore, the pivot table enables us to filter and sort the data easily and quickly. Users may focus on some or all parts of the data, even when the data tables are huge (some databases may contain a million or more records); thus users can obtain their desired data clearly and concisely.
A single data table can be used to create dozens of reports and charts for analyzing the data, with many cross-sections, simply by dragging fields to the appropriate locations.
Thus, the pivot table enables us to better understand processes and trends. It is also a useful tool for decision making. The pivot table data can be based on an existing Excel file or on other databases (i.e. Access or an SQL-based database).
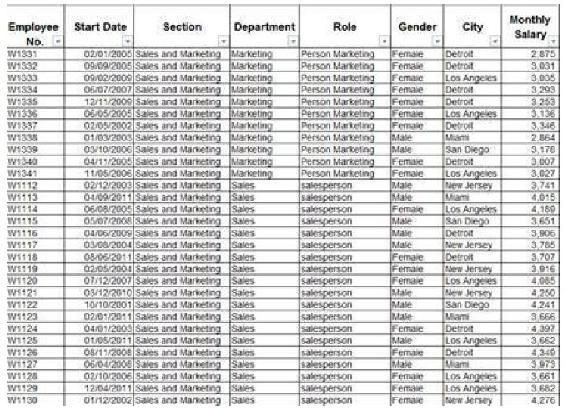
Since a picture is worth a thousand words, here are some examples of pivot tables, derived from the same database of Fig. 1.0 showing the details of factory employees:
Fig. Database of factory employees
The following pivot tables were derived from the database above:
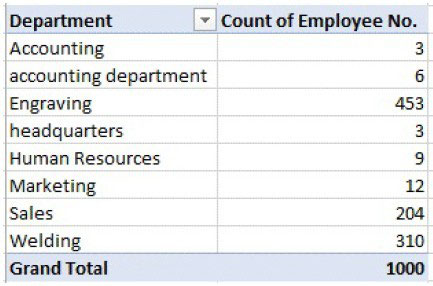
Number of employees in each department:
Fig. Number of employees in each department
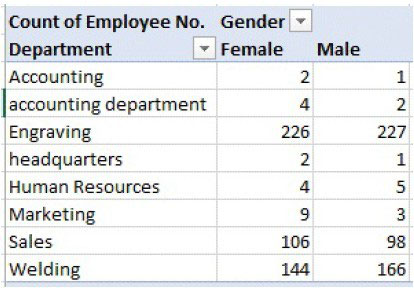
Distribution of genders in each department:
Fig. Distribution of genders in each department
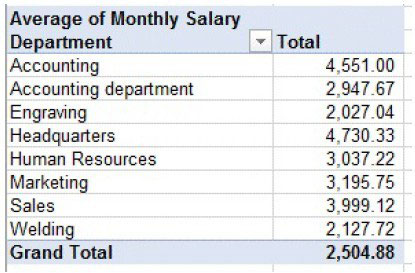
Average salary in each department:
Fig. Average salary in each department
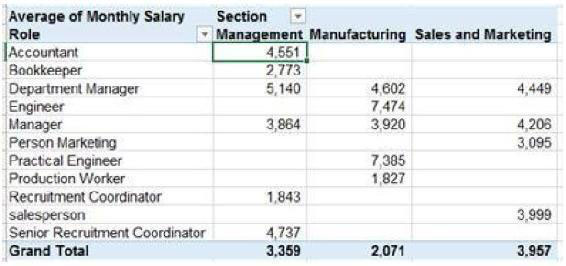
Average salary in each section, by role:
Fig. Average salary in each section by role
Basic Concepts
This chapter presents basic concepts relating to pivot tables. While studying and practicing, the following concepts will become clearer:
Data A raw data set, arranged in a table. This can be used as the source of a pivot table.
Pivot A table that displays data in different intersections, as described in this book.
A vertical section of the table consisting of data of the same type, i.e. first name, ID, city etc.
The columns header is called a field.
The cell is the intersection of a row and a column, and contains the data of the table.