Maayan Poleg - Excel 2013 Pivot Tables: Including the Data Model: Smart Data Analysis
Here you can read online Maayan Poleg - Excel 2013 Pivot Tables: Including the Data Model: Smart Data Analysis full text of the book (entire story) in english for free. Download pdf and epub, get meaning, cover and reviews about this ebook. year: 2015, publisher: CreateSpace Independent Publishing Platform, genre: Computer. Description of the work, (preface) as well as reviews are available. Best literature library LitArk.com created for fans of good reading and offers a wide selection of genres:
Romance novel
Science fiction
Adventure
Detective
Science
History
Home and family
Prose
Art
Politics
Computer
Non-fiction
Religion
Business
Children
Humor
Choose a favorite category and find really read worthwhile books. Enjoy immersion in the world of imagination, feel the emotions of the characters or learn something new for yourself, make an fascinating discovery.
- Book:Excel 2013 Pivot Tables: Including the Data Model: Smart Data Analysis
- Author:
- Publisher:CreateSpace Independent Publishing Platform
- Genre:
- Year:2015
- Rating:4 / 5
- Favourites:Add to favourites
- Your mark:
Excel 2013 Pivot Tables: Including the Data Model: Smart Data Analysis: summary, description and annotation
We offer to read an annotation, description, summary or preface (depends on what the author of the book "Excel 2013 Pivot Tables: Including the Data Model: Smart Data Analysis" wrote himself). If you haven't found the necessary information about the book — write in the comments, we will try to find it.
Maayan Poleg: author's other books
Who wrote Excel 2013 Pivot Tables: Including the Data Model: Smart Data Analysis? Find out the surname, the name of the author of the book and a list of all author's works by series.


Excel 2013 Pivot Tables: Including the Data Model: Smart Data Analysis — read online for free the complete book (whole text) full work
Below is the text of the book, divided by pages. System saving the place of the last page read, allows you to conveniently read the book "Excel 2013 Pivot Tables: Including the Data Model: Smart Data Analysis" online for free, without having to search again every time where you left off. Put a bookmark, and you can go to the page where you finished reading at any time.
Font size:
Interval:
Bookmark:
Managers, financiers and other Excel users:
Do your data tables contain too much information ?
Can you see patternsand trends at a glance?
Can you figure out the meaning of the data?
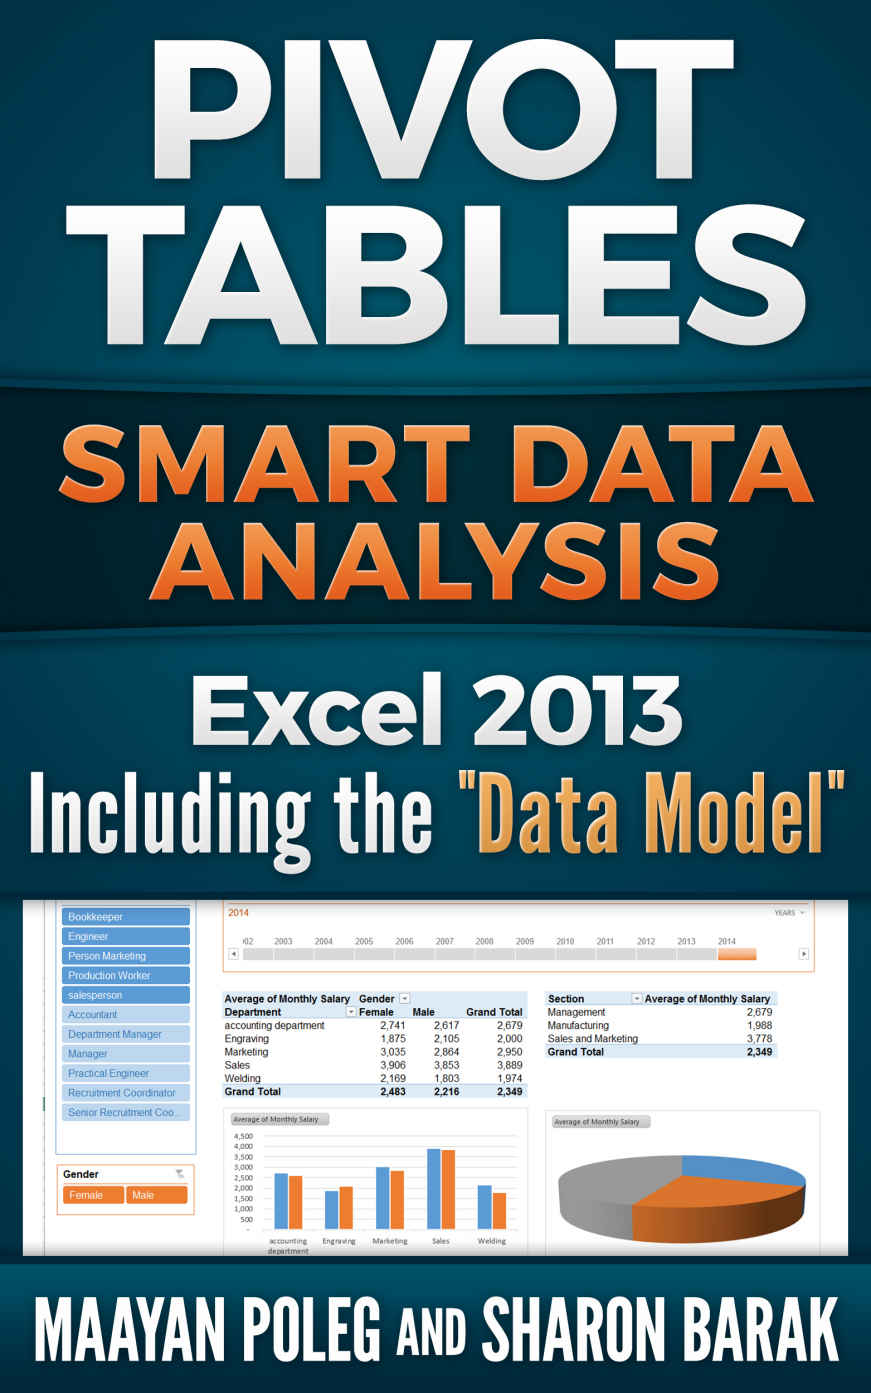
Would you like your report to look like this :
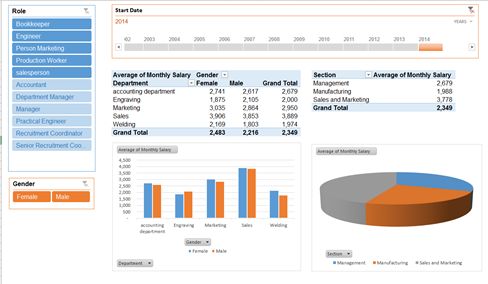
It takes less than 10 minutes!
A pivot table is a simple, yet powerful technique, thatenables Excel's users to transform data overload into meaningful and organizedknowledge.
With pivot tables you can:
See the data in dozensof different ways with a simple mouse drag
Perform fastcalculations with no need for formulas
Focus on another part of the data each timeand get a clear picture
Show more trends and patterns
Create dozens ofreports and charts to analyze your data
Table of Contents
This book teaches experienced Excel users how to usepivot tables, one of Microsoft Excels most powerful tools, for quick andefficient data analysis and to minimize formulae usage .
This book was written for Excel 2013 users. However,since the differences between Excel 2013 and Excel 2010 or Excel 2007 arenegligible and mainly manifested by the different groups or tabs in the ribbon,users of the older versions can use this book as well .
We would like to thank all of those who took the time toread the books draft, examining its readability and therefore ensuring that itoffers new possibilities to Excel users .
The main difference between pivot tables in Excel 2013and the older versions concerns the "Data Model" which will be dealtwith in the appendix.
This book was written specifically for Microsoft Excelusers who seek to extend and enhance their ability to analyze data from varioussources .
Many efforts were made to write a complete and reliablebook about pivot tables. However, the authors are not responsible for anyconsequences, loss or damage to any individual or organization which may resultby using the information provided in this book.
We recommend backing up your data before any changes arecarried out using this book .
Databases contain raw data on various topics, and areusually arranged in a tabular form. In many cases, data overload may make itdifficult to use the information and convert it into relevant knowledge.
A pivot table is a simple, yet powerful, technique whichenables Excel users to turn the data overload into well-organized andmeaningful knowledge .
By using a pivot table, users can perform variouscalculations on their data, such as calculating the average, counting, findingthe minimum and the maximum values and so on .
Furthermore, the pivot table enables us to filter andsort the data easily and quickly.
Users may focus on some or all parts of the data, evenwhen the data tables are huge (some databases may contain a million or morerecords); thus users can obtain their desired data clearly and concisely .
A single data table can be used to create dozens ofreports and charts for analyzing the data, with many cross-sections, simply bydragging fields to the appropriate locations .
Thus, the pivot table enables us to better understandprocesses and trends. It is also a useful tool for decision making .
The pivot table data can be based on an existing Excelfile or on other databases (i.e. Access or an SQL-based database).
Since a picture is worth a thousand words, here are someexamples of pivot tables, derived from the same database, which show thedetails of factory employees :

The following pivot tables were derived from thedatabase above:
Number of employees in each department :
Distribution of genders in each department :

Average salary in each department :
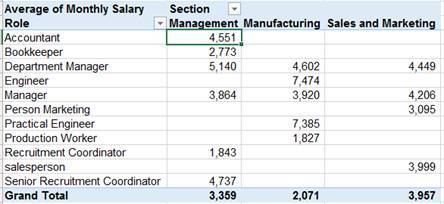
Average salary in each section, by role :
This chapter presents basic concepts relating to pivottables. While studying and practicing, the following concepts will become clearer :
Data Table: A raw data set, arranged in a table.This can be used as the source of a pivot table.
Pivot Table: A table that displays data indifferent intersections, as described in this book.
Column: A vertical section of the tableconsisting of data of the same type, i.e. first name, ID, city etc .
Field: The column's header is called a field ".
Cell: The cell is the intersection of a row and acolumn, and contains the data of the table.
Item: The data in a cell. For example, New Yorkand Detroit are items in the "City" field.
Record: A data collection which appears in onerow and belongs to the same entity, e.g. all the table data which displaysinformation regarding one person:
Name | St. and No . | City |
John Smith | Lexington | New York |
Each column must have a title.
The title should be written in a single row.
In a column, all the items should be of thesame data type (numbers, dates or strings).
The data table should not contain any mergedcells.
The data table should not contain subtotalsor grand totals.
Empty rows or columns should not remainwithin the table (if an empty row or column remains, Excel will treat the tableas two different ones).
After creating a pivot table, do not changethe titles of the fields, otherwise the pivot table values will be deleted.
Unique names for each column (when twofields are given the same name, the title of the second field will be appendedat end with 2, i.e. salary2").
Complete data for all records (when data ismissing, the calculations will only be applied to the available records. Thiscan be observed in the cases of calculations such as averages, etc).
Number of pivot table reports in the worksheet: Limitedby the available memory
Unique items for each field: 1,048,576
Row fields or column fields in the pivot table report:Limited by the available memory
Report filter in the pivot table report: (May be limited by the available memory)
Value fields in the pivot table report:
Formulas for calculated items in the pivot tablereport: Limited by the available memory
Please note:
Due to the limitations of the pivot table, and dependingon your personal computer data, you may prefer to save the exercises appearingin this book in a separate file or worksheet for each chapter.
Next pageFont size:
Interval:
Bookmark:
Similar books «Excel 2013 Pivot Tables: Including the Data Model: Smart Data Analysis»
Look at similar books to Excel 2013 Pivot Tables: Including the Data Model: Smart Data Analysis. We have selected literature similar in name and meaning in the hope of providing readers with more options to find new, interesting, not yet read works.
Discussion, reviews of the book Excel 2013 Pivot Tables: Including the Data Model: Smart Data Analysis and just readers' own opinions. Leave your comments, write what you think about the work, its meaning or the main characters. Specify what exactly you liked and what you didn't like, and why you think so.