• Complain

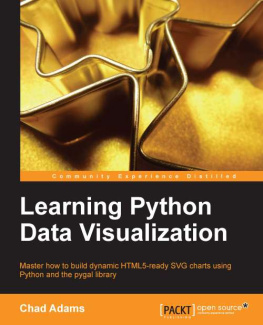
Adams - Learning Python data visualization: master how to build dynamic HTML5-ready SVG charts using Python and the pygal library

Here you can read online Adams - Learning Python data visualization: master how to build dynamic HTML5-ready SVG charts using Python and the pygal library full text of the book (entire story) in english for free. Download pdf and epub, get meaning, cover and reviews about this ebook. City: Birmingham;UK, year: 2014, publisher: Packt Publishing Ltd, genre: Home and family. Description of the work, (preface) as well as reviews are available. Best literature library LitArk.com created for fans of good reading and offers a wide selection of genres:

Romance novel Science fiction Adventure Detective Science History Home and family Prose Art Politics Computer Non-fiction Religion Business Children Humor

Choose a favorite category and find really read worthwhile books. Enjoy immersion in the world of imagination, feel the emotions of the characters or learn something new for yourself, make an fascinating discovery.

Adams Learning Python data visualization: master how to build dynamic HTML5-ready SVG charts using Python and the pygal library
  • Book:
    Learning Python data visualization: master how to build dynamic HTML5-ready SVG charts using Python and the pygal library
  • Author:
  • Publisher:
    Packt Publishing Ltd
  • Genre:
  • Year:
    2014
  • City:
    Birmingham;UK
  • Rating:
    3 / 5
  • Favourites:
    Add to favourites
  • Your mark:
    • 60
    • 1
    • 2
    • 3
    • 4
    • 5

Learning Python data visualization: master how to build dynamic HTML5-ready SVG charts using Python and the pygal library: summary, description and annotation

We offer to read an annotation, description, summary or preface (depends on what the author of the book "Learning Python data visualization: master how to build dynamic HTML5-ready SVG charts using Python and the pygal library" wrote himself). If you haven't found the necessary information about the book — write in the comments, we will try to find it.

Setting up your development environment -- Python refresher -- Getting started with pygal -- Advanced charts -- Tweaking pygal -- Importing dynamic data -- Putting it all together -- Further resources -- Appendix : references and resources.

Adams: author's other books


Who wrote Learning Python data visualization: master how to build dynamic HTML5-ready SVG charts using Python and the pygal library? Find out the surname, the name of the author of the book and a list of all author's works by series.

Learning Python data visualization: master how to build dynamic HTML5-ready SVG charts using Python and the pygal library — read online for free the complete book (whole text) full work

Below is the text of the book, divided by pages. System saving the place of the last page read, allows you to conveniently read the book "Learning Python data visualization: master how to build dynamic HTML5-ready SVG charts using Python and the pygal library" online for free, without having to search again every time where you left off. Put a bookmark, and you can go to the page where you finished reading at any time.

Light

Font size:

Reset

Interval:

Bookmark:

Make
Learning Python Data Visualization

Learning Python Data Visualization

Copyright 2014 Packt Publishing

All rights reserved. No part of this book may be reproduced, stored in a retrieval system, or transmitted in any form or by any means, without the prior written permission of the publisher, except in the case of brief quotations embedded in critical articles or reviews.

Every effort has been made in the preparation of this book to ensure the accuracy of the information presented. However, the information contained in this book is sold without warranty, either express or implied. Neither the author, nor Packt Publishing, and its dealers and distributors will be held liable for any damages caused or alleged to be caused directly or indirectly by this book.

Packt Publishing has endeavored to provide trademark information about all of the companies and products mentioned in this book by the appropriate use of capitals. However, Packt Publishing cannot guarantee the accuracy of this information.

First published: August 2014

Production reference: 1180814

Published by Packt Publishing Ltd.

Livery Place

35 Livery Street

Birmingham B3 2PB, UK.

ISBN 978-1-78355-333-4

www.packtpub.com

Cover image by Sabine Mehlstubl (<>)

Credits

Author

Chad Adams

Reviewers

Aniket Maithani

Atmaram Shetye

Giuseppe Vettigli

Ron Zacharski

Commissioning Editor

Akram Hussain

Acquisition Editor

Joanne Fitzpatrick

Content Development Editor

Parita Khedekar

Technical Editor

Venu Manthena

Copy Editors

Janbal Dharmaraj

Insiya Morbiwala

Sayanee Mukherjee

Aditya Nair

Deepa Nambiar

Stuti Srivastava

Project Coordinator

Neha Thakur

Proofreaders

Simran Bhogal

Maria Gould

Ameesha Green

Indexers

Hemangini Bari

Tejal Soni

Priya Subramani

Production Coordinator

Shantanu Zagade

Cover Work

Shantanu Zagade

About the Author

Chad Adams is a web and mobile software developer based in Raymore, Missouri, where he works as a mobile frontend architect creating visually appealing application software for iOS, Windows Phone, and the Web. He also creates project build systems for large development teams using programming languages such as Python and C#. He has a B.F.A. in Commercial Art and a Microsoft certification in HTML5, JavaScript, and CSS3. He has also spoken at conferences on topics that include Windows Phone development and Google Dart. In his off hours, Chad enjoys relaxing at his home and spending time with his wife, Heather, and son, Leo.

About the Reviewers

Aniket Maithani is a budding engineer and is currently pursuing a B.Tech in Computer Science and Engineering from Amity University. He is primarily interested in contributing to open source projects and believes in the FOSS/FLOSS ideology. He has been working in the field of embedded systems and open hardware for the last two years. Apart from coding and hacking around with regular stuff, he loves to play the guitar and write on his blog. He can be reached at <>.

There are a few people I would like to thank for helping me out. Firstly, my dad, who introduced me to the world of computers! Also, I would like to thank my professor Mr. Manoj Baliyan and my senior Mr. Anuvrat Parashar, who introduced me to the world of Python and its awesomeness. I would also like to thank my mentor, Satyakaam Goswami for always guiding me. Lastly, God Almighty for his kind grace and blessings.

Atmaram Shetye is a Computer Science and Engineering Graduate from Goa University. Having worked in a variety of companies, from start-ups to large multinational enterprises, he is a strong supporter of polyglot programming. He has spent most of his time programming in Python, while also using C, Objective-C, C++, and JavaScript at work. His areas of interest include artificial intelligence and machine learning. He is currently working as a Principal Software Engineer at CA Technologies, Bangalore.

Giuseppe Vettigli is a data scientist who has worked in the research industry and academia for many years. His work is focused on the development of machine learning models and applications to utilize information from structured and unstructured data. He also writes about scientific computing and data visualization in Python on his blog at http://glowingpython.blogspot.com.

Ron Zacharski completed a PhD in Computer Science at the University of Minnesota, focusing on artificial intelligence and computational linguistics. He is the author of the free online Python-based book, A Programmer's Guide to Data Mining: The Ancient Art of the Numerati (http://www.guidetodatamining.com). He is an Associate Professor of Computer Science at the University of Mary Washington. Ron is a novice Zen Buddhist monk.

www.PacktPub.com
Support files, eBooks, discount offers, and more

You might want to visit www.PacktPub.com for support files and downloads related to your book.

Did you know that Packt offers eBook versions of every book published, with PDF and ePub files available? You can upgrade to the eBook version at > for more details.

At www.PacktPub.com, you can also read a collection of free technical articles, sign up for a range of free newsletters and receive exclusive discounts and offers on Packt books and eBooks.

httpPacktLibPacktPubcom Do you need instant solutions to your IT - photo 1

http://PacktLib.PacktPub.com

Do you need instant solutions to your IT questions? PacktLib is Packt's online digital book library. Here, you can access, read and search across Packt's entire library of books.

Why subscribe?
  • Fully searchable across every book published by Packt
  • Copy and paste, print and bookmark content
  • On demand and accessible via web browser
Free access for Packt account holders

If you have an account with Packt at www.PacktPub.com, you can use this to access PacktLib today and view nine entirely free books. Simply use your login credentials for immediate access.

Preface

Greetings, this is Chad Adams, and welcome to Learning Python Data Visualization . In this book, we will cover the basics of generating dynamic charts and general graphics with code using the Python programming language. We will use the pygal library, a simple yet powerful graphing library written for Python, to explore the different types of charts we can create for various kinds of data.

We will also review the Python language itself and discuss working with file I/O and cover topics on working with data. We will then parse that data into a chart to create a dynamic charting application. We will also touch on more popular (and more advanced) libraries such as matplotlib and Plotly and build charts using these libraries and explore their features.

With this book, we will explore and build data visualizations using the basic toolsets used in many popular charting applications for the scientific, financial, medical, and pharmaceutical industries.

What this book covers
Next page
Light

Font size:

Reset

Interval:

Bookmark:

Make

Similar books «Learning Python data visualization: master how to build dynamic HTML5-ready SVG charts using Python and the pygal library»

Look at similar books to Learning Python data visualization: master how to build dynamic HTML5-ready SVG charts using Python and the pygal library. We have selected literature similar in name and meaning in the hope of providing readers with more options to find new, interesting, not yet read works.


Reviews about «Learning Python data visualization: master how to build dynamic HTML5-ready SVG charts using Python and the pygal library»

Discussion, reviews of the book Learning Python data visualization: master how to build dynamic HTML5-ready SVG charts using Python and the pygal library and just readers' own opinions. Leave your comments, write what you think about the work, its meaning or the main characters. Specify what exactly you liked and what you didn't like, and why you think so.