1. Introduction to Calorimetry
Calorimetry literally means heat measurement. For consistency with other forms of energy and to avoid confusion, the modern unit for heat is the joule which equals 0.2390 calories. The unit for heat rate is the watt or J/s with prefixes m for milli (103), for micro (106), and n for nano (1012). Heat can be measured in only three ways, referred to as temperature change, heat conduction, and power compensation (Hansen lists characteristics of these methods.
Table 1.1
Characteristics of the three methods for calorimetric measurement of heat. Note that the response time is approximately six times the time constant
Method | Detection limit | Response time | Governing equation | Notes |
|---|
Temperature change | 50500 J/mL | 0.51 s | Q = ( T )(heat capacity of vessel + contents) | T must be corrected for heat exchange with the surroundings. Detection limit increases with volume |
Heat conduction | 0.150 J/s or W | 550 min | Q = c T | The calorimetric constant, c , is affected by heat exchange with surroundings that does not go through the T sensor |
Power compensation | 110 nJ/s or nW | 10500 s | Q = c Power | Heat rate is calculated from changes in the input power to a heater/cooler used to maintain isothermal conditions. The calorimetric constant, c , must still be determined chemically because of possible heat exchange with surroundings |
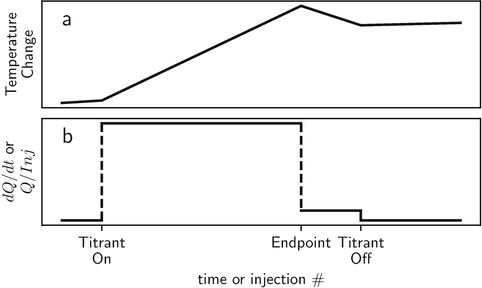
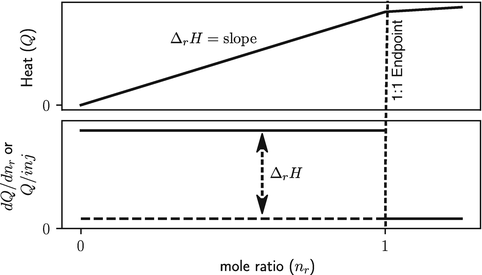
The raw data from a temperature change calorimeter is in the form of temperature versus time, and the raw data from heat conduction and power compensation calorimeters is in the form of heat rate versus time; see Fig.. Understanding the relation of these plots to the stoichiometric ( n ) and thermodynamic parameters ( K and r H ) obtainable from calorimetric titration data is key to understanding the practice and applications of titration calorimetry. Therefore, wherever appropriate, the figures in this brief are presented as species distribution, total heat ( Q ), and heat per increment of titrant ( dQ/dn ) and as functions of the solution composition. The raw data from calorimetric titrations are often displayed as temperature change or heat rate versus time to illustrate the time course of the reaction. Such plots are useful for providing a sense of the time constants of the calorimeter and reaction and assessing data quality since noise in the calorimetric signal is readily apparent. However, this information is instrument and experiment specific and outside the scope of this brief. For determinations of thermodynamic quantities, the raw data plots must be converted into plots of total heat or heat per injection, and plotting these data versus time or data point number should be discouraged because the direct relations between the data and stoichiometry and thermodynamic parameters are hidden in such plots. Also, note that there are two sign conventions for heat; the American sign convention defines heat as positive for an exothermic reaction, and the European convention defines heat as negative for an exothermic reaction. The enthalpy change (r H ) is defined to be negative for exothermic reactions in both systems.
Fig. 1.1
Schematic plots of the raw data from ( a ) temperature change and ( b ) heat conduction and power compensation calorimeters for a quantitative chemical reaction. The time constant is assumed to be zero for these plots
Fig. 1.2
Schematic plots of total heat to any point in the titration, Q , and of heat per increment of titrant, dQ/dn , versus the ratio of moles of titrant added to moles of titrate in the reaction vessel for a quantitative chemical reaction
Reactions in a calorimeter can be initiated by changing temperature, pressure, or concentration. Changing concentration includes mixing reactants inside the calorimeter reaction vessel and inserting a reaction mixture into the reaction vessel. Temperature-scanning calorimeters are commonly referred to as differential scanning calorimeters or DSCs; no common mnemonic has been attached to pressure-scanning calorimeters, and concentration-scanning calorimeters are referred to as titration calorimeters or ITCs.
Heat exchange with the surroundings must be taken into account with all three calorimetric methods. Maintaining the surroundings at exactly the same temperature as the reaction vessel, i.e., adiabatic conditions, would avoid this, but adiabatic control is difficult, costly, and imperfect, so most calorimeters operate with surroundings at a controlled constant temperature, i.e., with isothermal surroundings. (Isoperibol is sometimes used to describe surroundings as having both constant temperature and constant pressure.) The method for correction for heat exchange with the surroundings in temperature change calorimetry is based on Newtons law of cooling, and procedures are well-known and documented (Hansen and Hart ). Correction for heat exchange with the surroundings in heat conduction and power compensation calorimeters is instrument specific and is done by calibrating the value of the calorimetric constant with a standard chemical reaction or with an accurate electrical heater that mimics the heat from a reaction. The heater used for power compensation usually does not accurately mimic the placement of heat from a chemical reaction, and thus the heat exchange with the surroundings differs.
Accurate calibration of the calorimetric constant (the constant used to convert the measured signal, usually voltage, electrical current, or electrical power) into heat or a heat rate is obviously critical for obtaining accurate results. The reference standard is an electrical heater, but because of possible gains or losses of heat through thermal connections with the surroundings, calibration with an electrical heater should always be checked with a standard reaction that duplicates as closely as possible the reaction under study. Some reactions that can be used for this purpose are listed in Table . The reaction of Ca2+ with EDTA has recently been suggested as an alternative for this purpose, but the reaction is pH and buffer dependent and is thus not suggested for calibration of the calorimetric constant.
Table 1.2
Chemical reactions with well-known enthalpy changes. Data apply at infinite dilution and 25 C. For a complete list of r H values for reactions of pH buffers at other concentrations and temperatures, see Goldberg et al. ()
Reaction | Enthalpy change, r H /kJ mol1 | Log10 equilibrium constant, K |
|---|

