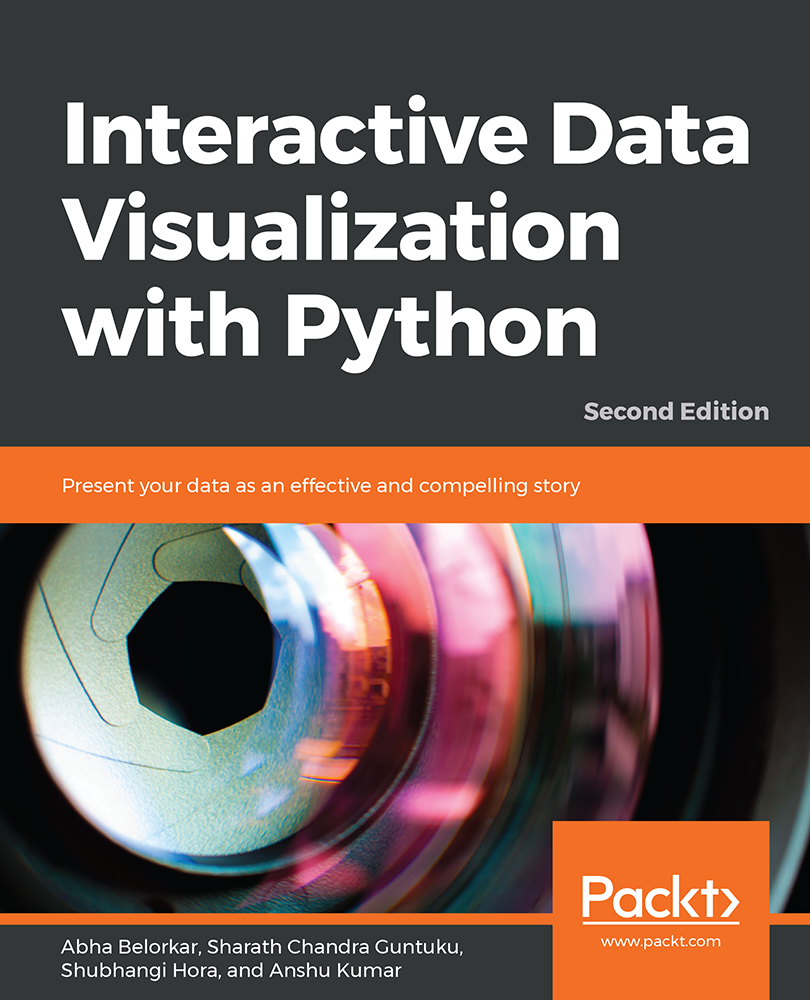
Abha Belorkar - Interactive Data Visualization with Python, 2nd Edition
Here you can read online Abha Belorkar - Interactive Data Visualization with Python, 2nd Edition full text of the book (entire story) in english for free. Download pdf and epub, get meaning, cover and reviews about this ebook. year: 2019, publisher: Packt Publishing, genre: Home and family. Description of the work, (preface) as well as reviews are available. Best literature library LitArk.com created for fans of good reading and offers a wide selection of genres:
Romance novel
Science fiction
Adventure
Detective
Science
History
Home and family
Prose
Art
Politics
Computer
Non-fiction
Religion
Business
Children
Humor
Choose a favorite category and find really read worthwhile books. Enjoy immersion in the world of imagination, feel the emotions of the characters or learn something new for yourself, make an fascinating discovery.

- Book:Interactive Data Visualization with Python, 2nd Edition
- Author:
- Publisher:Packt Publishing
- Genre:
- Year:2019
- Rating:4 / 5
- Favourites:Add to favourites
- Your mark:
Interactive Data Visualization with Python, 2nd Edition: summary, description and annotation
We offer to read an annotation, description, summary or preface (depends on what the author of the book "Interactive Data Visualization with Python, 2nd Edition" wrote himself). If you haven't found the necessary information about the book — write in the comments, we will try to find it.
Create your own clear and impactful interactive data visualizations with the powerful data visualization libraries of Python
Key Features- Study and use Python interactive libraries, such as Bokeh and Plotly
- Explore different visualization principles and understand when to use which one
- Create interactive data visualizations with real-world data
With so much data being continuously generated, developers, who can present data as impactful and interesting visualizations, are always in demand. Interactive Data Visualization with Python sharpens your data exploration skills, tells you everything there is to know about interactive data visualization in Python. Youll begin by learning how to draw various plots with Matplotlib and Seaborn, the non-interactive data visualization libraries. Youll study different types of visualizations, compare them, and find out how to select a particular type of visualization to suit your requirements. After you get a hang of the various non-interactive visualization libraries, youll learn the principles of intuitive and persuasive data visualization, and use Bokeh and Plotly to transform your visuals into strong stories. Youll also gain insight into how interactive data and model visualization can optimize the performance of a regression model. By the end of the course, youll have a new skill set thatll make you the go-to person for transforming data visualizations into engaging and interesting stories.
What you will learn- Explore and apply different static and interactive data visualization techniques
- Make effective use of plot types and features from the Matplotlib, Seaborn, Altair, Bokeh, and Plotly libraries
- Master the art of selecting appropriate plotting parameters and styles to create attractive plots
- Choose meaningful and informative ways to present your stories through data
- Customize data visualization for specific scenarios, contexts, and audiences
- Avoid common errors and slip-ups in visualizing data
This book intends to provide a solid training ground for Python developers, data analysts and data scientists to enable them to present critical data insights in a way that best captures the users attention and imagination. It serves as a simple step-by-step guide that demonstrates the different types and components of visualization, the principles, and techniques of effective interactivity, as well as common pitfalls to avoid when creating interactive data visualizations. Students should have an intermediate level of competency in writing Python code, as well as some familiarity with using libraries such as pandas.
Table of Contents- Introduction to Visualization with Python-Basic and Customized Plotting
- Static Visualization - Global Patterns and Summary Statistics
- From Static to Dynamic Visualization
- Interactive Visualization of Data across Strata
- Interactive Visualization of Data across Time
- Interactive Visualization of Data across Geographical Regions
- Avoiding Common Pitfalls to Create Interactive Visualization
Abha Belorkar is an educator and researcher in computer science. She received her bachelors degree in computer science from Birla Institute of Technology and Science Pilani, India and her Ph.D. from the National University of Singapore. Her current research work involves the development of methods powered by statistics, machine learning, and data visualization techniques to derive insights from heterogeneous genomics data on neurodegenerative diseases.
Sharath Chandra Guntuku is a researcher in natural language processing and multimedia computing. He received his bachelors degree in computer science from Birla Institute of Technology and Science, Pilani, India and his Ph.D. from Nanyang Technological University, Singapore. His research aims to leverage large-scale social media image and text data to model social health outcomes and psychological traits. He uses machine learning, statistical analysis, natural language processing, and computer vision to answer questions pertaining to health and psychology in individuals and communities.
Shubhangi Hora is a Python developer, artificial intelligence enthusiast, data scientist, and writer. With a background in computer science and psychology, she is particularly passionate about mental health-related AI. Apart from this, she is interested in the performing arts and is a trained musician.
Anshu Kumar is a data scientist with over 5 years of experience in solving complex problems in natural language processing and recommendation systems. He has an M.Tech. from IIT Madras in computer science. He is also a mentor at SpringBoard. His current interests are building semantic search, text summarization, and content recommendations for large-scale multilingual datasets.
Abha Belorkar: author's other books
Who wrote Interactive Data Visualization with Python, 2nd Edition? Find out the surname, the name of the author of the book and a list of all author's works by series.

