1.1 Introduction
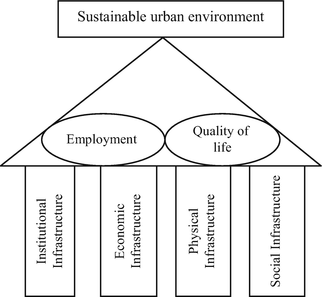
Smartness in a city means different things to different people. It could be smart design, smart utilities, smart housing, smart mobility, smart technology, etc. Institutional infrastructure (including governance), physical infrastructure, social infrastructure, and economic infrastructure constitute the four pillars of a city. A broad classification of each of these may be understood as follows. Institutional infrastructure refers to the activities related to governance, planning, and management of a city. Economic infrastructure includes skill development centers, industrial parks, export processing zones, trade centers, service centers, financial centers, etc. Social infrastructure relates to the components which work toward development of human and social capital. These include education, healthcare, entertainment, etc. Physical infrastructure refers to cost-efficient and intelligent stock such as urban mobility, housing, energy system, water supply, sewerage and drainage, sanitation facilities, solid waste management, etc. ().
Fig. 1.1
Pillars of a smart city (Source: http://indiansmartcities.in )
1.2 Definition
Municipal solid waste mainly includes wastes generated in commercial and residential areas within municipal or notified areas. Mostly, this excludes industrial hazardous wastes but often includes treated biomedical wastes ( http://www.moef.nic.in ).
Solid waste management is defined as the application of techniques to ensure an orderly execution of the various functions of collection, transport, processing, treatment, and disposal of solid waste (Zia and Devadas ).
1.3 Urbanization and Municipal Solid Waste
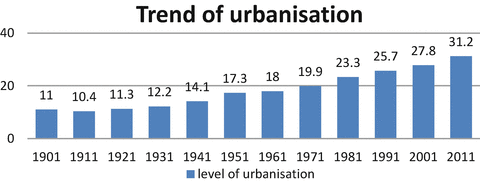
India is the second largest country in the world with a population of 1.21 billion, which is 18 % of the worlds human population. Three hundred seventy-seven million, i.e., 31.2 % of the total population lives in towns. The proportion of population living in urban areas has increased from 17.35 % in 1951 to 31.2 % in 2011 (Census, 2011), and it is projected that 50 % of Indias population will live in cities in the next 10 years (Vij ).
Fig. 1.2
Illustrating the trend of urbanization over the last decades (Source: Census of India, )
Indian cities add 0.20.6 kg of solid waste per capita per day. The rate of annual increase in waste generated per capita is 1.3 %, and the yearly rate of growth of urban population in India is 3.35 % (Census of India, ).
According to the Central Pollution Control Board report, there is no comprehensive short- and long-term plan with municipal authorities to handle MSW in accordance with the MSW Rules 2000. Majority of the municipal authorities do not have preparedness to set up waste processing and disposal facilities. So there is a need of efficient and smart solid waste management system in order to make a city smart and habitable (Status report on Solid Waste Management).
1.4 Management of Municipal Solid Waste
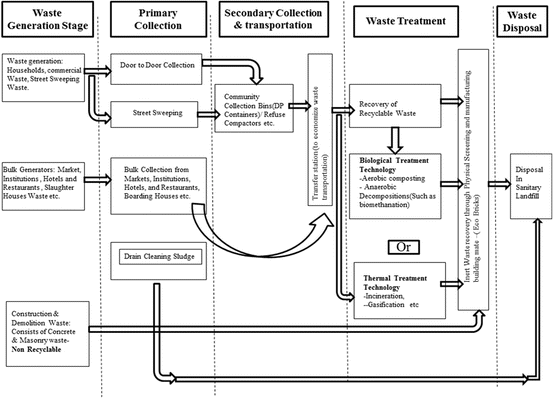
Management of municipal solid waste (MSW) involves various stages starting from primary collection, secondary collection, transportation, processing, and disposal in the last stage. A detailed flow chart of the various stages involved in the phenomenon of municipal solid waste management is shown in Fig..
Fig. 1.3
Illustrating the typical flow diagram of various stages involved in municipal solid waste management (Source: CPHEEO Manual on MSW, 2014)
The quantity and composition of municipal solid waste are the result of a global marketplace for the production, packaging, and consumption of products and services. The waste stream is significantly influenced by products manufactured from all over the world. The World Bank estimates that worldwide municipal solid waste generation was 1.3 billion metric tons in 2012. This is projected to increase to 2.2 billion metric tons per year by 2025. Most of this increase will come in rapidly growing cities in developing countries where there is inadequate infrastructure to handle it. In many parts of the world, citizens do not receive the basic services to assure that solid wastes are managed in a way that provides for protection of public health and the environment (Skinner ).
According to the International Solid Waste Association, in many developing countries, less than 50 % of the waste is collected on a regular or frequent basis, and disposal sites are no more than open uncontrolled dumps. As a result, wastes accumulate along roadways and in water bodies and are the source of public health problems and the spread of disease.
In terms of opportunity, solid waste management holds the potential to become a major participant in international climate agenda. This can also create access to financial resources to assist in development of functional waste management infrastructure in developing countries.
Waste offers a significant source of renewable energy. Waste-to-energy, landfill gas recovery and utilization, and use of anaerobic digester biogas can play important roles in reducing fossil fuel consumption and greenhouse gas emissions. Waste prevention, recycling, and composting can also significantly reduce GHG emissions. Waste policies and regulations can be strong national drivers of change. This has been clearly demonstrated in the US. The 2014 Environment Protection Agencys GHG Emissions Inventory reported that the emissions from waste operations decreased by 30 % from 1990 to 2012. This was due to the increased recycling of organic wastes (paper, paperboard, food waste, and yard trimmings) and a significant increase in the amount of landfill gas collected, recovered, and used as a renewable fuel. This is a remarkable success story that shows how waste reduction and resource recovery can play a major role in reducing GHG emissions from solid waste management activities (Skinner ).

