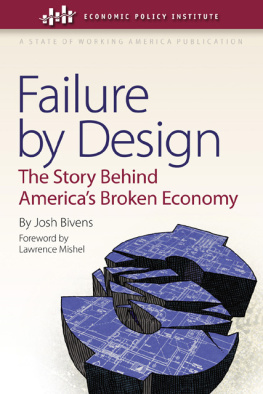
Josh Bivens - Failure by Design
Here you can read online Josh Bivens - Failure by Design full text of the book (entire story) in english for free. Download pdf and epub, get meaning, cover and reviews about this ebook. publisher: ILR Press, genre: Politics. Description of the work, (preface) as well as reviews are available. Best literature library LitArk.com created for fans of good reading and offers a wide selection of genres:
Romance novel
Science fiction
Adventure
Detective
Science
History
Home and family
Prose
Art
Politics
Computer
Non-fiction
Religion
Business
Children
Humor
Choose a favorite category and find really read worthwhile books. Enjoy immersion in the world of imagination, feel the emotions of the characters or learn something new for yourself, make an fascinating discovery.
- Book:Failure by Design
- Author:
- Publisher:ILR Press
- Genre:
- Rating:3 / 5
- Favourites:Add to favourites
- Your mark:
- 60
- 1
- 2
- 3
- 4
- 5
Failure by Design: summary, description and annotation
We offer to read an annotation, description, summary or preface (depends on what the author of the book "Failure by Design" wrote himself). If you haven't found the necessary information about the book — write in the comments, we will try to find it.
Failure by Design — read online for free the complete book (whole text) full work
Below is the text of the book, divided by pages. System saving the place of the last page read, allows you to conveniently read the book "Failure by Design" online for free, without having to search again every time where you left off. Put a bookmark, and you can go to the page where you finished reading at any time.
Font size:
Interval:
Bookmark:

Payroll employment and the number of jobs needed to keep up with the growth in working-age population
Unemployment rate for total population, age 16 and older, 1948-2010
The number of underemployed workers, including those unemployed, part-time for economic reasons, and marginally attached, 1994-2010
The job seekers ratio (the number of unemployed workers per every job opening)
Indexed job loss for four recessions
Three possible paths to recovery: following the path of recoveries in the 80s, 90s, and 2000s
Unemployment rates by race, 1972-present
Change in real median household income, by race and ethnicity, 2007-08 and 2008-09
The percentage-point increase in the poverty rate following business cycle peak to height of poverty, working-age population, five recessions
Rates of health insurance coverage, under-65 population, 2000-10
Median net worth of households by race, 2001-09
Bang-for-buck multipliers
Eight-quarter change in GDP growth and unemployment, 1983-present
The real value of the minimum wage, 1960-2009
Union coverage rate in the United States, 1973-2009
Imports and exports as a percent of GDP, 1947-present
Manufacturing and financial sectors as share of private economy
The NAIRU versus actual unemployment rate
Real family income growth by quintile, 1947-73 and 1979-2009
Share of pre-tax income growth, 1979-2007
Change in average, pre-tax household income by income group, 1979-2005
Fixed investment and finance sector value-added as shares of GDP
Real median family income and income assuming growth rate of average income
Poverty and twice-poverty rates, 1959-2009
Actual and simulated poverty, 1959-2009
Growth of production worker compensation and productivity, 1947-2009
Median hourly compensation by educational attainment and productivity growth, 1973-2009
Hourly wage and productivity growth by wage percentile, 1973-2009
Percentage change in male and female wages given 1 percentage-point decline in unemployment rate, by wage decile
Union wage premium by wage percentile
Annual earnings for full-time, median wage earner
Ratio of average CEO total direct compensation to average production worker compensation, 1965-2009
Ratio of earnings per full-time worker in finance versus the rest of the private sector
Share of under-65 population without health insurance coverage, 1959-2007
Retirement plans by type, 1979-2008
Life expectancy for male Social Securitycovered workers (age 60) by earnings group, 1972 and 2001
Personal savings rate
The ratio of household liabilities to disposable personal income, 1945-2009
Cyclically adjusted price earnings ratio, 1947-2009
A note on data sources and methods for the figures in this book
Most of the figures in this book are drawn from previous editions of The State of Working America . Those that are taken from other research are cited as such and a bibliography provided at the end of the book. For those readers interested in learning more about the sources and methods behind the construction of these charts, see the State of Working America Web site (www.StateOfWorkingAmerica.org). This book uses typical to mean median, that is, the family or worker in the exact middle of the distribution.
It surprises me that even with the slimmest of books one accumulates a mountain of debts, but so it goes. Although almost all of the larger insights in this book are channeled directly from conversations with other EPI researchers and writers, both past and present, I hesitate to list them because I might forget some. Among current EPI research staff, Kathryn Edwards, Kai Filion, Elise Gould, Andrew Green, Larry Mishel, and Heidi Shierholz all produced charts, provided data, or reviewed numbers for the book. Ross Eisenbrey, Jody Franklin, John Irons, and Joe Procopio all read the manuscript and offered helpful suggestions as well as generally helped keep the whole endeavor moving down the tracks. Anna Turner served as overall general manager for the bookproducing graphs, tracking down data, reviewing the text, and fact checking everything. It probably wouldve been very little extra work for her to have written the whole thing.
Despite all the valuable assistance I received, any bungles in translation are strictly mine.
Finally, Holley and Finn continue to provide more-than-plausible excuses as to why Ive yet to reach my full professional potential, and for this I couldnt be happier.
For more than 20 years The State of Working America has provided an unvarnished look at the living standards of low- and middle-income Americans. Along the way, it has established a reputation as the gold standard in tracking trends in income, wages, hours, jobs, and inequality, leading the Financial Times to call it the most comprehensive independent analysis of the U.S. labor market. This effort has reflected two core values of the Economic Policy Institute since its founding: (1) a belief that judgments on how well the economy is performing should depend upon whether it is delivering rising living standards to the vast majority; and (2) the importance of empirical documentation as the basis for economic policy.
More often than not over these 20 years, The State of Working America has detailed the data behind an economy that was not working particularly well for working Americans. Even during times of respectable economic growth for the nation as whole, typical families living standards grew sluggishly. There were exceptions, to be sure. The late 1990s saw low unemployment that provided even workers at the bottom-end of the wage scale with the bargaining power they needed to demand raises, and wage growth across the board was rapid and equitable.
Outside this brief window, however, the story of the American economy since TheState of Working Americas inception has been largely one of unfulfilled promise, with overall growth failing to translate into prosperity for most because the fruits of this growth were concentrated only among those at the very top of the income ladder.
For 11 editions, The State of Working America has documented the facts behind these trends, charting the rapid rise of economic inequality and the much-less rapid rise of wages for most Americans. It has largely hewn to pure documentation, with little narrative or policy prescription. However, after more than 20 years of growing economic inequality and the worst recession since World War II, it became increasingly clear to us at the Economic Policy Institute that there was an economic narrative hidden between the lines of all the admittedly dry data. But, like the visual puzzles that embed a big picture in repeating patterns of shapes that obscure it, this story may not be obvious to those not looking for it or those who just werent looking at the right angle.
Consequently, instead of a single massive tome, this latest incarnation of The State of Working America is a bundle of products, both print and electronic. Most of the data that the books habitual users have become accustomed to will be provided in a more widely accessible form: online in a new State of Working America Web siteboth as the tables and charts that traditionally formed the backbone of the previous printed editions as well as being offered in raw form for more data-curious readers to do with what they will. However, in addition to providing the data and analysis, EPI believes that the unique circumstances of todays economy beg for more interpretation, for an articulation of the story behind Americas broken economy. This book provides that story.
Font size:
Interval:
Bookmark:
Similar books «Failure by Design»
Look at similar books to Failure by Design. We have selected literature similar in name and meaning in the hope of providing readers with more options to find new, interesting, not yet read works.
Discussion, reviews of the book Failure by Design and just readers' own opinions. Leave your comments, write what you think about the work, its meaning or the main characters. Specify what exactly you liked and what you didn't like, and why you think so.


