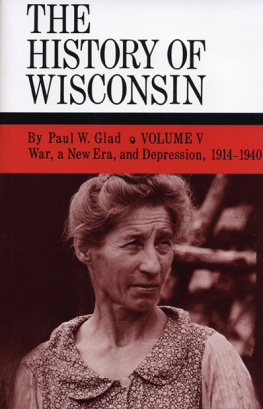
Paul W. Glad - War, a New Era, and Depression, 1914-1940
Here you can read online Paul W. Glad - War, a New Era, and Depression, 1914-1940 full text of the book (entire story) in english for free. Download pdf and epub, get meaning, cover and reviews about this ebook. year: 2013, publisher: Wisconsin Historical Society Press, genre: Politics. Description of the work, (preface) as well as reviews are available. Best literature library LitArk.com created for fans of good reading and offers a wide selection of genres:
Romance novel
Science fiction
Adventure
Detective
Science
History
Home and family
Prose
Art
Politics
Computer
Non-fiction
Religion
Business
Children
Humor
Choose a favorite category and find really read worthwhile books. Enjoy immersion in the world of imagination, feel the emotions of the characters or learn something new for yourself, make an fascinating discovery.

- Book:War, a New Era, and Depression, 1914-1940
- Author:
- Publisher:Wisconsin Historical Society Press
- Genre:
- Year:2013
- Rating:3 / 5
- Favourites:Add to favourites
- Your mark:
War, a New Era, and Depression, 1914-1940: summary, description and annotation
We offer to read an annotation, description, summary or preface (depends on what the author of the book "War, a New Era, and Depression, 1914-1940" wrote himself). If you haven't found the necessary information about the book — write in the comments, we will try to find it.
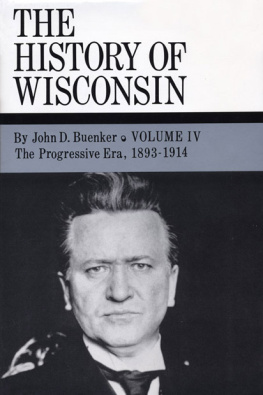
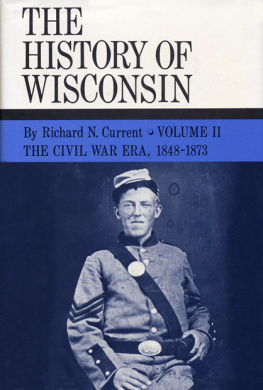
The fifth volume in The History of Wisconsin series covers the years from the outbreak of World War I to the eve of American entry into World War II. In between, the rise of the womans movement, the advent of universal suffrage, and the great experiment of Prohibition are explored, along with the contest between newly emergent labor unions and powerful business and industrial corporations. Author Paul W. Glad also investigates the Great Depression in Wisconsin and its impact on rural and urban families in the state. Photographs and maps further illustrate this volume which tells the story of one of the most exciting and stressful eras in the history of the state.
Paul W. Glad: author's other books
Who wrote War, a New Era, and Depression, 1914-1940? Find out the surname, the name of the author of the book and a list of all author's works by series.


War, a New Era, and Depression, 1914-1940 — read online for free the complete book (whole text) full work
Below is the text of the book, divided by pages. System saving the place of the last page read, allows you to conveniently read the book "War, a New Era, and Depression, 1914-1940" online for free, without having to search again every time where you left off. Put a bookmark, and you can go to the page where you finished reading at any time.
Font size:
Interval:
Bookmark:
| Name | Birthplace | Party | Term in Office | Birth/Death |
| FRANCIS E. MCGOVERN | Wisconsin | Rep. | Jan. 2, 1911Jan. 4, 1915 | 18661946 |
| EMANUEL L. PHILIPP | Wisconsin | Rep. | Jan. 4, 1915Jan. 3, 1921 | 18611925 |
| JOHN J. BLAINE | Wisconsin | Rep. | Jan. 3, 1921Jan. 3, 1927 | 18751934 |
| FRED R. ZIMMERMAN | Wisconsin | Rep. | Jan. 3, 1927Jan. 7, 1929 | 18801954 |
| WALTER J. KOHLER, SR. | Wisconsin | Rep. | Jan. 7, 1929Jan. 5, 1931 | 18751940 |
| PHILIP F. LA FOLLETTE | Wisconsin | Rep. | Jan. 5, 1931Jan. 2, 1933 | 18971965 |
| ALBERT J. SCHMEDEMAN | Wisconsin | Dem. | Jan. 2, 1933Jan. 7, 1935 | 18641946 |
| PHILIP F. LA FOLLETTE | Wisconsin | Prog. | Jan. 7, 1935Jan. 2, 1939 | 18971965 |
| JULIUS P. HEIL | Germany | Rep. | Jan. 2, 1939Jan. 4, 1943 | 18761949 |
E MPLOYING statistical methods in historical research enables historians to convert cumbersome columns of data into a few manageable values that describe relationships among variables such as income, religion, ethnicity, and voting behavior. In reality, all the attributes of individuals and societies constitute interwoven matrices of complexly related variables, but as figures in census reports and the like, they are extracted and placed in tables of unrelated independent variables. With contingency tables, multiple regression, and other statistical methods, historians can partially recombine variable relationships that the enumerators separated. Having done that, they may be able to test the accuracy of their theories about past relationships among variables. In this study, PRE (Proportional Reduction of Error) procedures were employed to determine how votes for members of the La Follette family were influenced by ethnicity, religious affiliation, economic prosperity, and place of residence.
Prediction and prediction error are the bases of PRE statistics. In PRE, prediction is simply an estimate or guess of what value any single influence will have on a given variable. Prediction error is the degree or amount that the prediction varies from the actual value. The objective of PRE statistics is to introduce new variables which, in conjunction with the original variable, will reduce the amount of prediction error.
A fundamental measure of prediction error employed in this study is standard deviation. The first step in determining standard deviation is to figure a variables mean by adding together the values of all the variables cases (X1 + X2 + X3 Xn = X), and then dividing by the number of cases (N) in the variable. Thus the formula:  . Secondly, the mean of the variable is subtracted from each case to determine how much that case deviates from the mean. This deviation is the amount of error for each case
 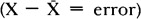 . Third, each deviation is squared:
  . The squares are then added together, producing the sum of squares:
 . The sum of squares is then divided by the number of cases in the variable:
  . When the square root of this result is taken, we have the standard deviation ( S ) of the variable:
 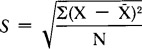 . The standard deviation tells us how much on average the cases deviate from the mean. In PRE the objective is to reduce the deviation in the dependent variable by taking one or more independent variables into consideration.
To test the hypothesis that there was a strong relationship between the dependent variable ( e.g., per cent vote for Robert M. La Follette in 1916) and the independent variable ( e.g., per cent Norwegian + Swedish), two steps must be taken. First, using the election returns from all 71 counties, the standard deviation of the La Follette vote alone must be established. The S for the 1916 La Follette vote is 14.11. Second, a modified S must be calculated to take per cent Norwegian-Swedish into account. To accomplish this objective, the Norwegian-Swedish variable may be divided into four categories ranging from high to low in per cent Norwegian-Swedish, and each county may be placed in one of the four categories. The mean is taken for the La Follette vote in the counties placed in each of the four categories. Then four separate standard deviations are established, one for each category. These four S s may be averaged to produce a modified S which for the 1916 La Follette vote, as influenced by the per cent Norwegian-Swedish, is 7.17. By taking an independent variable into account, then, we have reduced prediction error by 6.94 (14.117.17). In this form the statistic tells us little but that the error has been reduced. How does this result relate to similar examples? Results may be standardized by reducing all examples to a scale extending from zero to one. The scale represents the proportion of the error that has been reduced and is calculated by dividing the result by the standard deviation of the dependent variable. In this instance, 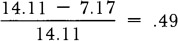 . By taking the per cent Norwegian + Swedish into account, we have reduced by 49 per cent our original error in the 1916 vote for La Follette.
Should we wish to include a second independent variable in the interpretation of data, a simple form of cluster analysis is useful. The new independent variable, e.g. Per Farm Production, is divided into four categories as was the Norwegian-Swedish variable. Together the two independent variables form a contingency table with sixteen cells, each cell containing a cluster of counties (). On this table, counties in the first cell rank high in per cent Norwegian-Swedish and high in Per Farm Production. Cell 16 contains the counties that rank low in both. The remaining cells represent gradation from one extreme to the other. Each county fits into one of the cells. Adams County, for example, was in the Hi-Med category with its Norwegian-Swedish population and in the Lo category in Per Farm Production. Adams County is therefore a part of the cluster in cell 14. In 1916, Adams County voted 67 per cent for La Follette.
The procedure for eliciting the amount by which per cent Norwegian-Swedish and Per Farm Production reduced the prediction error in the La Follette vote is the same as that described previously. Now, however, we have sixteen categories with sixteen separate standard deviations rather than four. In the case of Adams County in 1916, the amount of error is reduced by 31 per cent.
Font size:
Interval:
Bookmark:
Similar books «War, a New Era, and Depression, 1914-1940»
Look at similar books to War, a New Era, and Depression, 1914-1940. We have selected literature similar in name and meaning in the hope of providing readers with more options to find new, interesting, not yet read works.
Discussion, reviews of the book War, a New Era, and Depression, 1914-1940 and just readers' own opinions. Leave your comments, write what you think about the work, its meaning or the main characters. Specify what exactly you liked and what you didn't like, and why you think so.