Springer International Publishing Switzerland 2017
Alexander E.S. Van Driessche , Matthias Kellermeier , Liane G. Benning and Denis Gebauer (eds.) New Perspectives on Mineral Nucleation and Growth 10.1007/978-3-319-45669-0_1
1. Nucleation Pathways in Electrolyte Solutions
James J. De Yoreo 1, 2 , Nico A. J. M. Sommerdijk 3, 4 and Patricia M. Dove 5
(1)
Physical Sciences Division, Pacific Northwest National Laboratory, Richland, WA 99352, USA
(2)
Departments of Materials Science and Engineering and of Chemistry, University of Washington, Seattle, WA 98195, USA
(3)
Laboratory of Materials and Interface Chemistry and Center of Multiscale Electron Microscopy, Department of Chemical Engineering and Chemistry, Eindhoven University of Technology, 513, 5600 MB Eindhoven, The Netherlands
(4)
Institute for Complex Molecular Systems, Eindhoven University of Technology, 513, 5600 MB Eindhoven, The Netherlands
(5)
Department of Geosciences, Virginia Tech, Blacksburg, VA 24061, USA
Keywords
Nucleation theory Heterogeneous nucleation Spinodal decomposition Cluster aggregation Multistep crystallization
1.1 Introduction
The formation of a solid crystalline phase from a solution has been the subject of scientific investigation for centuries (Gibbs and Smith ). This chapter provides a brief introduction to these various mechanisms, characteristics, and controls of crystal formation from solution and illustrates each using the results of recent experimental and computational studies.
1.2 Classical Nucleation Theory
The modern theory of nucleation, commonly referred to as classical nucleation theory (CNT), originates with the work of Gibbs in the late 1800s (Gibbs and Smith ).
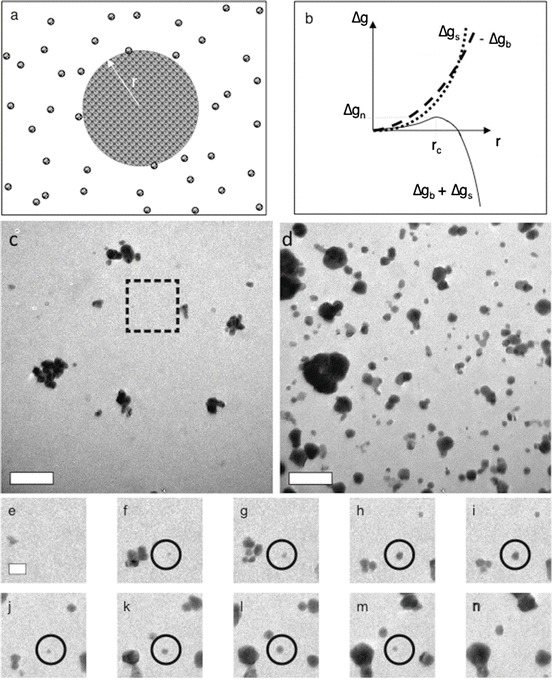
Fig. 1.1
( a ) Formation of a spherical nucleus of radius r from a solution leads to the free-energy changes shown in ( b ). The crossover of the bulk ( g b ) and surface ( g s ) terms combined with their opposing signs leads to a free-energy barrier. ( c n ) Nucleation of Au nanoparticles. ( c , d ) Sequence of LP-TEM images showing the nucleation of Au nanoparticles from a gold chloride solution containing citrate as a capping agent. As seen in the example highlighted by the circle in ( e n ), which were taken from the region delineated by the rectangular box in ( c ), many of the nascent nuclei fail to reach the point of spontaneous growth and instead fluctuate in size until they disappear. This behavior demonstrates particle formation results from unstable fluctuations, the hallmark of classical nucleation. Times in s: ( c ) 0.0, ( d ) 103.2, ( e ) 2.1, ( f ) 8.0, ( g ) 16.4, ( h ) 34.9, ( i ) 36.6, ( j ) 44.8, ( k ) 60.5, ( l ) 73.1, ( m ) 93.3, and ( n ) 103.2. Scale bars : ( c , d ) 500 nm, ( e ) 200 nm. Scale in ( f n ) is same as ( e ) (Panels a and b : (De Yoreo and Vekilov ) used by permission of the Microscopy Society of America)
The existence of fluctuations and the stochastic nature of nucleation are illustrated in Fig. ):
where J is the nucleation rate per volume, A is a material-dependent constant, E A is the activation energy associated with the atomic processes such as desolvation, attachment, and/or structural rearrangement within the nucleus prior to or during phase separation that must occur to form the nucleus, k is Boltzmanns constant, T is the temperature, g c is the height of the free-energy barrier, B is a constant that depends on the shape and density of the nucleating solid, as well as the temperature, is the interfacial free energy, and is the supersaturation (= /kT ) (De Yoreo and Vekilov ).
In the classical view of crystallization, post nucleation growth largely occurs in the absence of particle-coalescence events and results in a population of stable macroscopic particles (Andreassen and Lewis ), though if true equilibrium could be reached, only one large particle would be present at the end of the process.
1.3 Spinodal Decomposition
The second mechanism of a first-order phase transition, spinodal decomposition, differs from nucleation in that it is a barrier-free process (Bray ). Once the spinodal is crossed, particles are generated in such large numbers that they can grow by direct collision and coalescence with other particles. When the products of spinodal decomposition consist of two liquids, a secondary event is required to produce the first solid.
Evidence for spinodal decomposition in electrolyte solutions is limited. Experimental work documents the formation of liquid MgSO4 at high temperature (Wang et al. inset) at a concentration equal to that at which the nanoparticles appeared.
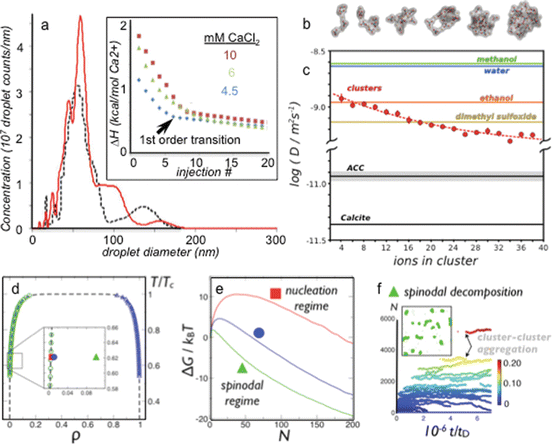
Fig. 1.2
( a ) Nanoparticle tracking analysis of a calcium carbonate solution during sequential injections of 6 mM CaCl2(aq) solution into a carbonate/bicarbonate buffer. Nanoparticles develop at about the tenth injection, which is concurrent with the emergence of a new phase as determined by calorimetry. At the phase transition (tenth injection, black curve ), droplets with a distributed diameter averaging 60 nm emerge. The addition of more Ca2+ to the solution (13th injection, red curve ) yields more detectable particles emerging at 6070 nm diameter, and they seem to grow larger as well. Inset to ( a ) the enthalpy of reaction during the titration of CaCl2(aq) into 20 mM carbonate buffer, pH 8.5. The data shows that there is an endothermic phase transition occurring, indicating that the phase transition is entropically driven. ( b ) Snapshots taken from replica-exchange molecular dynamics simulations show the evolution of polymeric cluster configurations toward denser structures at larger sizes. ( c ) The diffusivity of calcium ions within the cluster species at various stages of growth compared to two solid phases of calcium carbonate, calcite, and ACC (from simulation) and the self-diffusivities (experimental) of several common solvents. Error bars represent the mean +/ standard error for N =6 simulation trajectories at each cluster size. ( d ) Temperature-density phase diagram for the 2-D Ising lattice gas with a spinodal region. ( e ) Free-energy barrier to phase change diminishes with supersaturation where the red, blue, and green curves correspond to the free energy vs. cluster size (N monomers) at the similarly colored points in the phase diagram in panel d . Red lies just before crossing the binodal, blue is in the binodal region, and green is in the spinodal region where the barrier is k T . ( f ) In the small-barrier (spinodal) regime, an evolving cluster population is generated (see inset snapshot). The distribution of cluster sizes (color scheme indicates amount of system mass contained in the clusters) versus time where t D is the characteristic time for a monomer to diffuse a length equal to its diameter (Panel a : (Bewernitz et al. ) used by permission of the American Association for the Advancement of Science)

