The movement of a single vehicle can impact significantly the performance of a traffic stream. Consider a slow-moving vehicle at the front of a long line of vehicles traveling behind it, with no-passing opportunities. The performance of this lead vehicle significantly affects the speed and travel time of the following vehicles. Understanding the characteristics, performance, and movement of each vehicle type allows us to model groups of vehicles and to evaluate the performance of the traffic stream. Furthermore, the movement of individual vehicles allows us to develop better highway design and traffic control solutions. For example, understanding the acceleration and deceleration constraints of various vehicle types can help us design more effective passing zones and to allocate appropriate yellow and all-red intervals at signalized intersections.
This chapter first discusses the basic equations of motion for a single vehicle. The second part of the chapter discusses vehicle, driver, and environmental characteristics and their effects on vehicle motion.
Motion of a Single Vehicle
The motion of a single vehicle can be fully described mathematically using equations of motion. These are based on laws of physics and provide relationships between key parameters such as acceleration, speed, distance traveled, and travel time. This section derives and presents these equations of motion for various types of movement (constant speed, constant acceleration, and varying acceleration). The discussion in this section is based to a large degree on [].
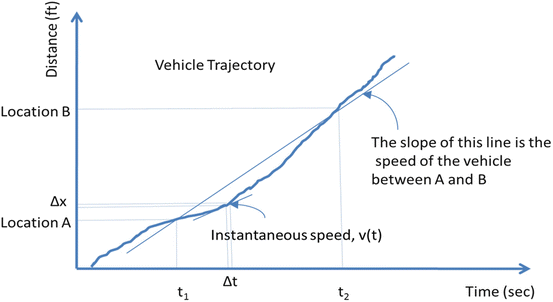
Figure presents a diagram with the trajectory of a vehicle, i.e., a plot providing the vehicles position as a function of time. The horizontal axis of the figure indicates the time, while the vertical axis indicates the respective location of the vehicle. This type of diagram is called a timespace diagram . The trajectory of the vehicle is the line connecting the locationtime points along the vehicles path. The average speed of the vehicle between locations A and B ( V AB) can be determined as follows:
Fig. 1.1
Trajectory of a vehicle
where d AB is the distance between points A and B (ft).
Visually, the average speed of the vehicle is determined by the slope of the line connecting the two points as shown in Fig. , the speed of the vehicle near location A is lower than the average speed between points A and B, as the slope of that line (labeled instantaneous speed) is smaller.
Mathematically, the instantaneous speed of the vehicle at time t , v ( t ), can be provided by:
where d x is the change in distance and d t the change in time.
The distance covered by the vehicle in time d t can be determined as:
By integrating both parts of this equation, we have:
This is the general equation for determining the distance traveled as a function of speed. Given any speed function, this equation can provide the distance traveled in time t , x ( t ).
The change in speed per unit of time is called acceleration ( a ). Mathematically, it is described as a function of speed as follows:
When the final speed of the vehicle is lower than its initial speed, the sign of d v is negative and the vehicle is decelerating. Throughout this book, we will be referring to both types of movements as acceleration, and we will be using acceleration functions.
Given the relationship between speed and distance provided above, acceleration can also be described as:
The speed function can be determined as follows:


