Advanced Daily Fantasy Football
Copyright 2017 Advanced Sports Analytics
All rights reserved.
ASA Staff
Brandon Adams (Founder)
Brandon Adams taught undergrad economics courses at Harvard for nine years in game theory, behavioral finance, and international macroeconomics. Hes currently ranked 36 th in Rotogrinders overall DFS rankings. His favorite DFS sport is NFL.
Mason Grimshaw
Mason Grimshaw is currently a rising senior in Business Analytics at the Massachusetts Institute of Technology, and has been a member of Advanced Sports Analytics since May of 2016. Possessing a love of sports, a background in computer science, and a modest statistical toolkit, Mason provides the data, context, and analysis needed to make useful judgments in the world of Daily Fantasy Sports.
Stewart Gibson
Stewart Gibson is a New York City-based digital advertising analyst and holds a MS in Applied Statistics from New York University and a BA in Economics from Bucknell University. Growing up, Stewart had always been interested in the intersection of sports and statistics. In his work with Advanced Sports Analytics during the past year, Stewart has applied his passion for data visualization and practical statistical storytelling to Daily Fantasy Sports strategy to deliver insightful tools and methods for optimizing players' approach.
ASAs Online Offerings
At our site, advancedsportsanalytics.com, we will be providing full datasets used for the creation of this book for our subscribers. These datasets include:
- NFL Vegas Data from 2012 to 2016
- Injury Data from 2016
- Fantasy Outcomes for the 2016 Season
We will also be producing in-season data and charts similar to those found in this book to keep you up to date on the latest trends.
- Actual Points vs. O/U
- Fantasy Points vs. Actual Points
- Fantasy Points vs. Spread
- Home/Away FP Distributions (team-specific)
- FP Trendlines (team-specific)
- FP Proportion Boxplots (team-specific)
- Correlation Matrices
- Run/Pass Play Counts (league-aggregate)
- FP vs. Opponent Season Average
- Distributions (player-specific)
- FP vs. game outcomes (team-specific)
Visit advancedsportsanalytics.com/membership-options / for more details.
Contents
Chapter 1 How Many Fantasy Points Will Be Scored in a Game?
The approach of this book is to start with a 30,000-foot view of the daily fantasy football landscape, and then dive into the finer details in later chapters. At Advanced Sports Analytics, our belief is that the first step in exploring an NFL slate is examining the Vegas expected point totals in each game. In this chapter and the next, we show how to estimate the total expected fantasy points in each game, based on the expected point total, the point spread, and the characteristics of the teams in the game (especially their pass vs run propensity). This is an ideal first step in attacking a slate, in our opinion. Later work can then focus on the expected share of total expected fantasy points that will go to each player.
Vegas Over/Unders and Actual Scoring
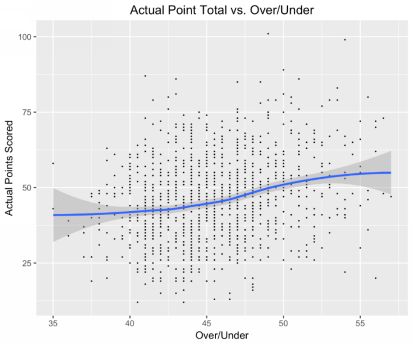
The plot above shows the sum of team scores as a function of the Vegas Over/Under for that game over the past five years (2012 2016) using a Loess Fit. Loess models work to model the data in local, horizontal windows and then piece together the smaller models in order to create the plot you see above.
This graph shows an interesting trend that occurs at about an Over/Under of 45. Its here that the slope starts to increase, and the Over/Under becomes very useful in spotting a game with a higher score. This is to say that not all increases in Over/Under are created equally. The difference in the expected actual total between Over/Unders of 40 to 45 is about 3, but the difference between 45 and 50 is about 7.
Knowing this, high total games are especially valuable in terms of scoring, and therefore, fantasy production. It really pays to have exposure to these high Over/Under games.
As an aside, we should note that this doesnt imply an inefficiency on the part of Vegas Over/Unders. The over-under is an estimate of the median outcome; an unbiased over-under estimate (one that is unbeatable from the gamblers perspective) is one where half the scores will be below the estimate and half above. But fantasy football participants should be more interested in the expected mean point total.
Variability of Scoring
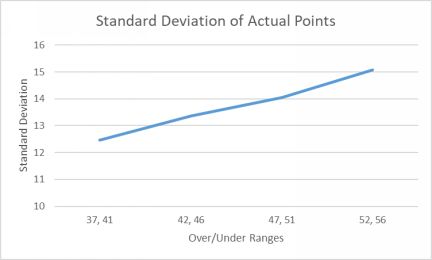
A remarkable feature of games with increasing Over/Unders is that they also increase in volatility. To the right is a plot of the standard deviation of actual scoring against increasing Over/Unders. The relationship is remarkable in its simplicity. If youre looking for upside, you need exposure to high Over/Under games not only because they create a high amount of fantasy points, but also because they have a higher chance of blowing up. Our data shows that, because the scores of higher point total games are more likely to blow up, the mean points scored is increasing faster than the median.
On the lower end of the spectrum, you see more consistency, but that does not necessarily make those teams an easy target for cash games as the teams also tend to score fewer fantasy points with the decrease in actual scoring.
Implied Points and Upside
For the purposes of this next section, implied points are calculated using the over/under and spread of a game. A teams implied point total is calculated as:

Using the chart below, we can move further in the discussion about high total games and upside. It shows the percent chance of a team reaching a certain score within certain implied points ranges.
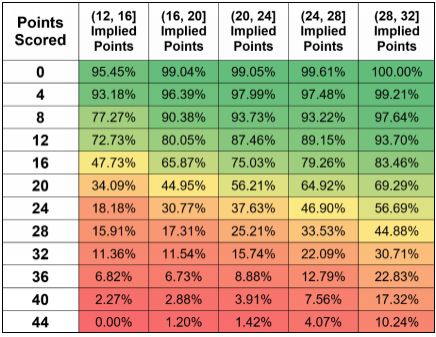
The chart demonstrates that games with a higher over/under prediction have higher probabilities of achieving given scores, as expected. For example, teams with implied points in the (28, 32] range achieve a score of 44 10.24% of the time while none of the other buckets reach a score of 44 more than 5% of the time. In fact, teams with implied points less than 25 do it less than 3% of the time! However, it is also noteworthy that lower predicted scores are more likely to achieve their prediction.
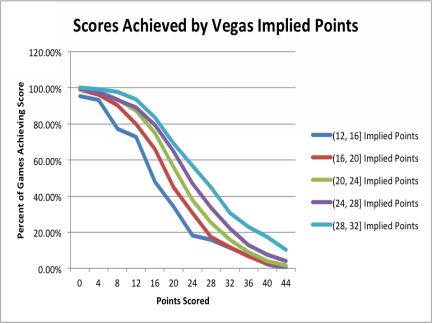
The following chart displays the same information above, but for the graphically minded.
Chapter 2 How Many Fantasy Points are Scored per Actual Point?
In this chapter, we will analyze the relationship between total offensive fantasy points as a function of the actual points scored by the team in that game. Well begin by looking at the league as a whole, then move towards teams, and end with an analysis of positions within teams.
In doing this analysis, we will show that certain team are better at converting actual points to fantasy points, and provide tools that will enable you to predict the sum of fantasy points for all teams. Because some teams are able to score more fantasy points for each actual point, it is possible to target teams with lower expected totals, but roughly the same fantasy point upside.
Next page
