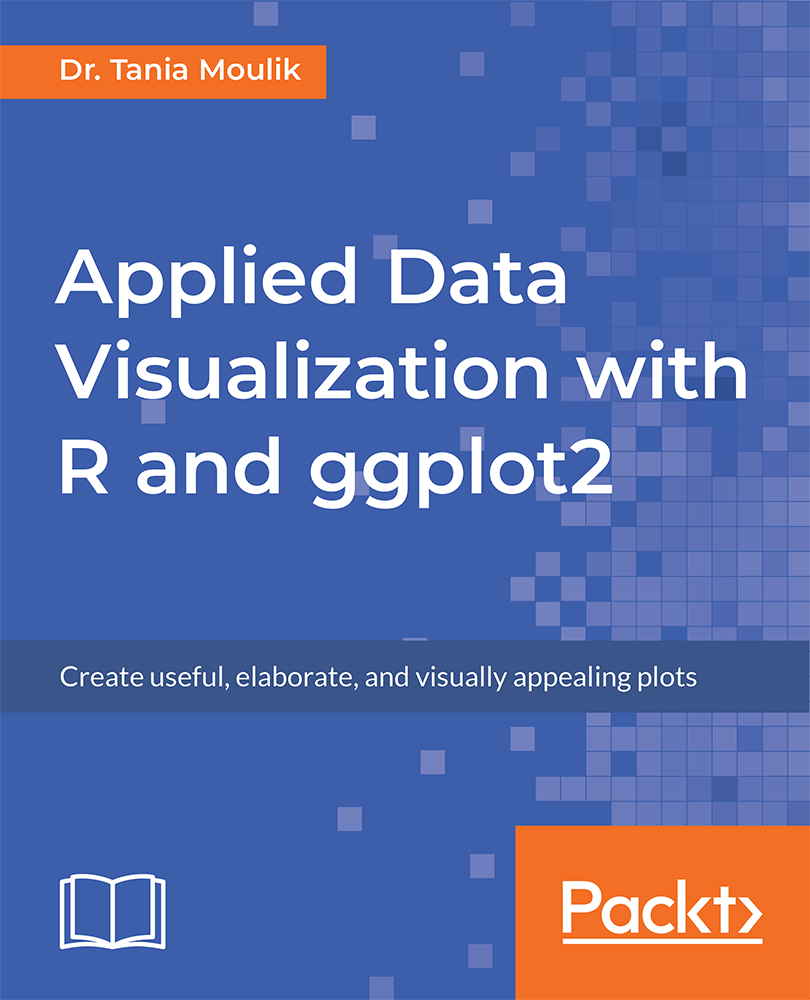
Applied Data Visualization with R and ggplot2
Create useful, elaborate, and visually appealing plots
Dr. Tania Moulik

BIRMINGHAM - MUMBAI
Applied Data Visualization with R and ggplot2
Copyright 2018 Packt Publishing
All rights reserved. No part of this book may be reproduced, stored in a retrieval system, or transmitted in any form or by any means, without the prior written permission of the publisher, except in the case of brief quotations embedded in critical articles or reviews.
Every effort has been made in the preparation of this book to ensure the accuracy of the information presented. However, the information contained in this book is sold without warranty, either express or implied. Neither the author, nor Packt Publishing or its dealers and distributors, will be held liable for any damages caused or alleged to have been caused directly or indirectly by this book.
Packt Publishing has endeavored to provide trademark information about all of the companies and products mentioned in this book by the appropriate use of capitals. However, Packt Publishing cannot guarantee the accuracy of this information.
Acquisitions Editor: Aditya Date
Content Development Editors: Darren Patel, Tanmayee Patil
Production Coordinator: Arvindkumar Gupta
First published: September 2018
Production reference: 1270918
Published by Packt Publishing Ltd.
Livery Place
35 Livery Street
Birmingham
B3 2PB, UK.
ISBN 978-1-78961-215-8
www.packtpub.com
About the Author
Dr. Tania Moulik has a PhD in particle physics. She worked at CERN and the Tevatron at Fermi National Accelerator Laboratory in IL, USA. She has worked with C++, Python, and R. She also worked in big data projects and grid computing. She has a passion for data analysis and likes to share her knowledge with others who would like to delve into the world of data analytics. She especially likes R and ggplot2 as a powerful analytics package.
mapt.io
Mapt is an online digital library that gives you full access to over 5,000 books and videos, as well as industry leading tools to help you plan your personal development and advance your career. For more information, please visit our website.
Why Subscribe?
Spend less time learning and more time coding with practical eBooks and Videos from over 4,000 industry professionals
I mprove your learning with Skill Plans built especially for you
Get a free eBook or video every month
- Mapt is fully searchable
Copy and paste, print, and bookmark content
PacktPub.com
Did you know that Packt offers eBook versions of every book published, with PDF and ePub files available? You can upgrade to the eBook version at www.PacktPub.com and as a print book customer, you are entitled to a discount on the eBook copy. Get in touch with us at service@packtpub.com for more details.
At www.PacktPub.com , you can also read a collection of free technical articles, sign up for a range of free newsletters, and receive exclusive discounts and offers on Packt books and eBooks.
Preface
This book introduces you to the world of data visualization by talking about the basic features of ggplot2. Learn all about setting up the R environment and then begin exploring features of ggplot2. Grammar of graphics and geometric objects are the fundamentals you must know before you dive deep into the plotting techniques. Read and discover what are layers, scales, coordinates, and themes, and explore how you can use them to transform your data into aesthetical graphs. Learn the simple plots, such as histograms, and then some advanced plots, such as superimposing plots and density plots. Learn to plot trends, correlations, and statistical summaries. After reading this book, your data visualizations will wow clients.
After completing this book, you will be able to:
- Set up the R environment, RStudio, and explain structure of ggplot2
- Distinguish types of variables and use best practices to visualize them
- Change visualization defaults to reveal more information about data
- Implement the grammar of graphics in ggplot2 such as scales and faceting
- Build complex, aesthetic visualizations with ggplot2 analysis methods
- Logically and systematically explore complex relationships
- Compare variables in a single visual, with advanced plotting methods
Who This Book Is For
This book is meant for professionals, who work with data and R, and for students, who want to enhance their data analysis skills by adding informative and professional visualizations. We assume that readers know basics of the R language, its commands, and objects.
What This Book Covers
, Basic Plotting in ggplot2, will help you to understand Kubernetes patterns which would be presented with the examples from Kubernetes itself and external applications.
, Grammar of Graphics and Visual Components, will help you to cover accessing Kubernetes API with raw HTTP queries to complex libraries with both in-cluster and out-cluster examples.
, Advanced Geoms And Statistics, will present extension capabilities of Kubernetes with custom resource definitions, custom controllers, dynamic admission controllers, and custom schedulers.
To Get the Most out of This Book
For an optimal experience, we recommend the following hardware configuration:
- Processor: Intel Core i5 or equivalent
- Memory: 4GB RAM
- Storage: 35 GB available space
You'll also need the following software installed in advance:
- OS: Windows 7 SP1 64-bit, Windows 8.1 64-bit, or Windows 10 64-bit
- Browser: Google Chrome, Latest Version
- Installing R:
- To install the R package and libraries, go to http://cran.us.r-project.org/ in your browser.
- Click on Download R for Windows, click on base, then click on Download R 3.5.0 for Windows (or any newer version that appears).
- Install R. Leave all default settings as they are in the installation options.
- To install RStudio, go to http://rstudio.org/download/desktop .
- Choose the default installation.
- Open RStudio after installation. It uses the underlying R package and will open it automatically in the IDE.
Download the Example Code Files
You can download the example code files for this book from your account at www.packtpub.com. If you purchased this book elsewhere, you can visit www.packtpub.com/support and register to have the files emailed directly to you.
You can download the code files by following these steps:
- Log in or register at www.packtpub.com.
- Select the SUPPORT tab.
- Click on Code Downloads & Errata .
- Enter the name of the book in the Search box and follow the onscreen instructions.
Next page

