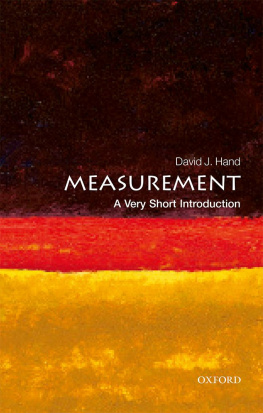
Hand - Statistics: A Very Short Introduction
Here you can read online Hand - Statistics: A Very Short Introduction full text of the book (entire story) in english for free. Download pdf and epub, get meaning, cover and reviews about this ebook. City: Oxford, year: 2008, publisher: Oxford University Press, genre: Science. Description of the work, (preface) as well as reviews are available. Best literature library LitArk.com created for fans of good reading and offers a wide selection of genres:
Romance novel
Science fiction
Adventure
Detective
Science
History
Home and family
Prose
Art
Politics
Computer
Non-fiction
Religion
Business
Children
Humor
Choose a favorite category and find really read worthwhile books. Enjoy immersion in the world of imagination, feel the emotions of the characters or learn something new for yourself, make an fascinating discovery.

Statistics: A Very Short Introduction: summary, description and annotation
We offer to read an annotation, description, summary or preface (depends on what the author of the book "Statistics: A Very Short Introduction" wrote himself). If you haven't found the necessary information about the book — write in the comments, we will try to find it.
Hand: author's other books
Who wrote Statistics: A Very Short Introduction? Find out the surname, the name of the author of the book and a list of all author's works by series.
Statistics: A Very Short Introduction — read online for free the complete book (whole text) full work
Below is the text of the book, divided by pages. System saving the place of the last page read, allows you to conveniently read the book "Statistics: A Very Short Introduction" online for free, without having to search again every time where you left off. Put a bookmark, and you can go to the page where you finished reading at any time.
Font size:
Interval:
Bookmark:
Surrounded by statistics
To those who say there are lies, damned lies, and statistics, I often quote Frederick Mosteller, who said that it is easy to lie with statistics, but easier to lie without them.
I want to begin with an assertion that many readers might find surprising: statistics is the most exciting of disciplines. My aim in this book is to show you that this assertion is true and to show you why it is true. I hope to dispel some of the old misconceptions of the nature of statistics, and to show what the modern discipline looks like, as well as to illustrate some of its awesome power, as well as its ubiquity.
In particular, in this introductory chapter I want to convey two things. The first is a flavour of the revolution that has taken place in the past few decades. I want to explain how statistics has been transformed from a dry Victorian discipline concerned with the manual manipulation of columns of numbers, to a highly sophisticated modern technology involving the use of the most advanced of software tools. I want to illustrate how todays statisticians use these tools to probe data in the search for structures and patterns, and how they use this technology to peel back the layers of mystification and obscurity, revealing the truths beneath. Modern statistics, like telescopes, microscopes, X-rays, radar, and medical scans, enables us to see things invisible to the naked eye. Modern statistics enables us to see through the mists and confusion of the world about us, to grasp the underlying reality.
So that is the first thing I want to convey in this chapter: the sheer power and excitement of the modern discipline, where it has come from, and what it can do. The second thing I hope to convey is the ubiquity of statistics. No aspect of modern life is untouched by it. Modern medicine is built on statistics: for example, the randomized controlled trial has been described as one of the simplest, most powerful, and revolutionary tools of research. Understanding the processes by which plagues spread prevent them from decimating humanity. Effective government hinges on careful statistical analysis of data describing the economy and society: perhaps that is an argument for insisting that all those in government should take mandatory statistics courses. Farmers, food technologists, and supermarkets all implicitly use statistics to decide what to grow, how to process it, and how to package and distribute it. Hydrologists decide how high to build flood defences by analysing meteorological statistics. Engineers building computer systems use the statistics of reliability to ensure that they do not crash too often. Air traffic control systems are built on complex statistical models, working in real time. Although you may not recognize it, statistical ideas and tools are hidden in just about every aspect of modern life.
One good working definition of statistics might be that it is the technology of extracting meaning from data. However, no definition is perfect. In particular, this definition makes no reference to chance and probability, which are the mainstays of many applications of statistics. So another working definition might be that it is the technology of handling uncertainty. Yet other definitions, or more precise definitions, might put more emphasis on the roles that statistics plays. Thus we might say that statistics is the key discipline for predicting the future or for making inferences about the unknown, or for producing convenient summaries of data. Taken together these definitions broadly cover the essence of the discipline, though different applications will provide very different manifestations. For example, decision-making, forecasting, real-time monitoring, fraud detection, census enumeration, and analysis of gene sequences are all applications of statistics, and yet may require very different methods and tools. One thing to note about these definitions is that I have deliberately chosen the word technology rather than science. A technology is the application of science and its discoveries, and that is what statistics is: the application of our understanding of how to extract information from data, and our understanding of uncertainty. Nevertheless, statistics is sometimes referred to as a science. Indeed, one of the most stimulating statistical journals is called just that: Statistical Science.
So far in this book, and in particular in the preceding paragraph, I have referred to the discipline of statistics, but the word statistics also has another meaning: it is the plural of statistic. A statistic is a numerical fact or summary. For example, a summary of the data describing some population: perhaps its size, the birth rate, or the crime rate. So in one sense this book is about individual numerical facts. But in a very real sense it is about much more than that. It is about how to collect, manipulate, analyse, and deduce things from those numerical facts. It is about the technology itself. This means that a reader hoping to find tables of numbers in this book (e.g. sports statistics) will be disappointed. But a reader hoping to gain understanding of how businesses make decisions, of how astronomers discover new types of stars, of how medical researchers identify the genes associated with a particular disease, of how banks decide whether or not to give someone a credit card, of how insurance companies decide on the cost of a premium, of how to construct spam filters which prevent obscene advertisements reaching your email inbox, and so on and on, will be rewarded.
All of this explains why statistics can be both singular and plural: there is one discipline which is statistics, but there are many numbers which are statistics.
So much for the word statistics. My first working definition also used the word data. The word data is the plural of the Latin word datum, meaning something given, from dare, meaning to give. As such, one might imagine that it should be treated as a plural word: the data are poor and these data show that, rather than the data is poor and this data shows that. However, the English language changes over time. Increasingly, nowadays data is treated as describing a continuum, as in the water is wet rather than the water are wet. My own inclination is to adopt whatever sounds more euphonious in any particular context. Usually, to my ears, this means sticking to the plural usage, but occasionally I may lapse.
Data are typically numbers: the results of measurements, counts, or other processes. We can think of such data as providing a simplified representation of whatever we are studying. If we are concerned with school children, and in particular their academic ability and suitability for different kinds of careers, we might choose to study the numbers giving their results in various tests and examinations. These numbers would provide an indication of their abilities and inclinations. Admittedly, the representation would not be perfect. A low score might simply indicate that someone was feeling ill during the examination. A missing value does not tell us much about their ability, but merely that they did not sit the examination. I will say more about data quality later. It matters because of the general principle (which applies throughout life, not merely in statistics) that if we have poor material to work with then the results will be poor. Statisticians can perform amazing feats in extracting understanding from numbers, but they cannot perform miracles.
Of course, many situations do not appear to produce numerical data directly. Much raw data appears to be in the form of pictures, words, or even things such as electronic or acoustic signals. Thus, satellite images of crops or rain forest coverage, verbal descriptions of side effects suffered when taking medication, and sounds uttered when speaking, do not appear to be numbers. However, close examination shows that, when these things are measured and recorded, they are translated into numerical representations or into representations which can themselves be further translated into numbers. Satellite pictures and other photographs, for example, are represented as millions of tiny elements, called pixels, each of which is described in terms of the (numerical) intensities of the different colours making it up. Text can be processed into word counts or measures of similarity between words and phrases; this is the sort of representation used by web search engines, such as Google. Spoken words are represented by the numerical intensities of the waveforms making up the individual parts of speech. In general, although not all data are numerical, most data are translated into numerical form at some stage. And most of statistics deals with numerical data.
Font size:
Interval:
Bookmark:
Similar books «Statistics: A Very Short Introduction»
Look at similar books to Statistics: A Very Short Introduction. We have selected literature similar in name and meaning in the hope of providing readers with more options to find new, interesting, not yet read works.
Discussion, reviews of the book Statistics: A Very Short Introduction and just readers' own opinions. Leave your comments, write what you think about the work, its meaning or the main characters. Specify what exactly you liked and what you didn't like, and why you think so.


