Using
Microsoft Excel 365, Stocks Data Type, Power Query,
Pivot Charts, REST Web Services,
And
JSON
To
Web Scrape Market, Financial and Economic Data
John Lee
First Edition
Copyright 2020
All rights reserved
Print, May 25, 2020
The contents of this book may not be reproduced, duplicated, or transmitted without the direct written permission of the author.
Under no circumstances will any legal responsibility or blame be held against the publisher or any reparation, damages, or monetary loss due to the information herein, either directly or indirectly.
Legal Notice:
You cannot amend, distribute, sell, use, quote, or paraphrase any part of the content within this book without the consent fo the author.
Disclaimer Notice
Please note the information contained within this document is for educational and entertainment purposes only. No warranties of any kind are expressed or implied. Readers acknowledge that the author is not engaging in the rendering of legal, financial, medical, or professional advice. Please consult a licensed professional before attempting any techniques outlined in this book.
By reading this document, the reader agrees that under no circumstances is the author responsible for any losses, direct or indirect, which are incurred as a result of the use of the information contained within this document, including, but not limited to, errors, omissions, or inaccuracies.
Table of Contents
Example Microsoft Excel 365 Workbooks
To obtain the sample Microsoft Excel 365 workbooks, please send an e-mail to . In the subject header include Excel 365 Workbooks. A PayPal credit card invoice will be sent to you for $5. After payment, the Excel 365 workbooks files will be sent to you.
Introduction
It used to be very expensive in both time, money, and energy to get market, economic and financial data. People would get stock prices from CRSP tapes, read the paper version of the Wall Street Journal, buy the paper version of Value Line financial research. This all changed with the start of the Internet in the 1990s. The Internet removed the middlemen in delivering information and data to the user. Another big contributing factor in reducing the cost of getting data is with the evolution of Microsoft Excel embracing the Internet. Usually, users use web browsers like Microsoft Explorer, Firefox, and Google Chrome to access the internet. Excel and other applications can now also access the web.
One big overarching theme of the Internet is FREE. With web browsers and Microsoft Excel 365, we can quickly and often at no cost promptly get data to get an excellent general understanding of the current economic, financial, and market conditions. If we want a deeper sense of economic and market conditions, we can pay for more valuable data for a reasonable fee. Go to https://www.office.com/ to buy a subscription of Excel 365.
In Excel 365, we will use the Stocks Data Type and Power Querys features to retrieve data from the internet. We will also use Power Querys capability to consume REST web services and Power Querys ability to format JSON data. The Stocks Data Type feature is only available in Excel 365.
We will see that Microsoft Excel 365 will significantly reduce the time to gather and process market and economic data and give us more time to analyze and understand the market, economic and financial data.
There are many versions of Microsoft Excel. Microsoft Excel 365 is a subscription-based application. In this book, when we indicate Excel, we are referring to Microsoft Excel 365.
1.1 Linked Data Type
1.1.1 Stocks Data Type
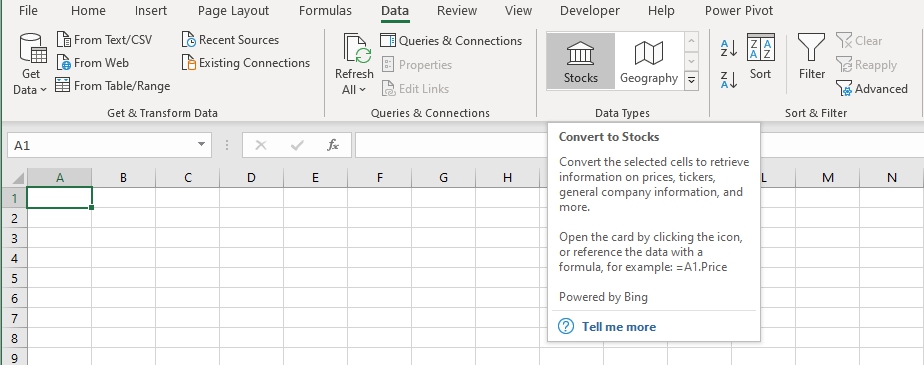
In June of 2019, Microsoft added a new and exciting feature called Linked Data Type exclusively to Microsoft Excel 365. Linked data types contain a connection to an online data source outside of Microsoft Excel 365. There are two types of Linked Data Type : Stocks and Geography. Data Types are part of the Data tab in Excel 365.
The Stocks data type name implies that only stock prices can be retrieved automatically into Excel 365; this is not the case. The Stocks data type can retrieve many different types of current market data. The Stocks data type can retrieve the following types of current market data: stock, market index, currency, cryptocurrency, bonds, futures, mutual funds, and exchange-traded funds (ETF).
The exciting thing about the Stocks data type feature is that it is now much easier to transfer market data into Excel 365. Before the Stocks data type feature, a lot of programming was required. Now, this feature reduces a lot of steps and time to get the data into Excel 365.
1.2 Data Providers
The Stocks data type is powered by Refnitiv and NASDAQ. The Geography data type is power by Bing.
National Association of Securities Dealers Automated Quotation s or NASDAQ is an electronic exchange system where most major technology stocks are traded. Refinitiv is a global provider of financial markets data and infrastructure. Go to https://www.refinitiv.com to find more about Refinitv and https://www.nasdaq.com/ to find more about NASDAQ.
1.3 Sample Stocks Data Type Excel Template
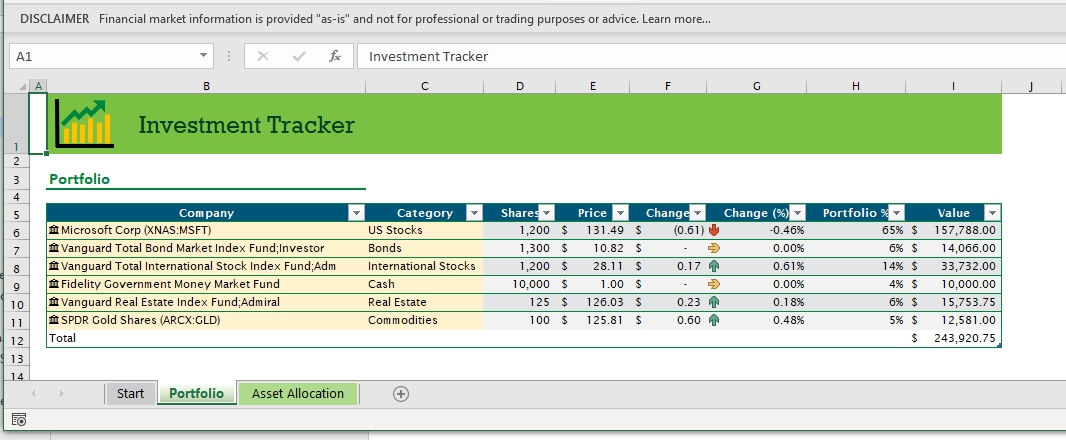
A sample template to demonstrate the Excel 365 Stocks data type features is located at https://templates.office.com/EN-US/investment-tracker-TM00414392
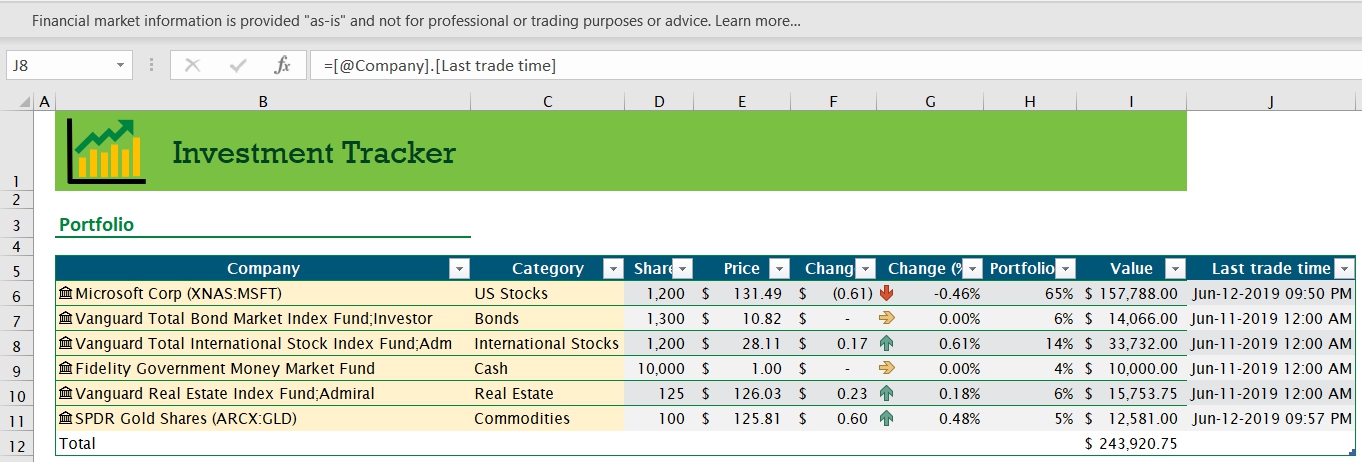
The sample template showed the following investment tracker. The investment tracker used the Stocks data type feature to get investment value for each financial security
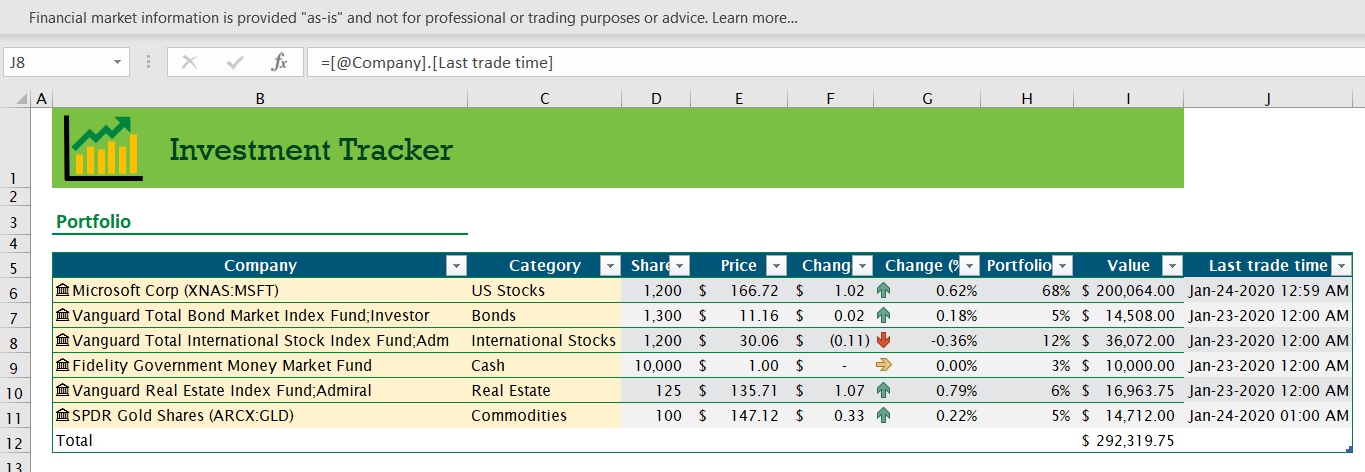
One significant deficiency of the above investment tracker report is it does not show the date of the price. The Stocks data type does have a field that shows the last trade date. The report below shows includes the Last Trade Date. Field.
With almost no effort, I was able to update the portfolio balance for May 06, 2020.
I was able to quickly and painlessly see that the above portfolio increases by $48,399.
1.4 Power Query and other Data Providers
We will demonstrate Microsoft Excels Stocks data type feature to retrieve many different types of market data. We will also use Excels Power Query feature to complement Excels Stocks data type feature. Power Query can retrieve data from the internet that is not available to the Stocks data type feature. We will use Power Query to set up the process of automating the retrieval of market data from the Internet. Power Query can read many, but not all websites like a web browser. After reading the website, Power Query can format data and put it into Excel. We will retrieve market data from Finance.Yahoo.com, CNBC.com, Nasdaq.com, Fidelity.com, and many other financial websites.
One of the biggest deficiencies of the Stocks data type feature in Excel is the inability to get historical market data into Excel 365. But in the blog, https://www.microsoft.com/en-us/microsoft-365/blog/2019/06/05/stocks-data-type-microsoft-nasdaq-refinitiv-empower-investors-with-real-time-data/ , Rob Howard, a senior Director of Microsoft 365, indicated that historical market data might be available in a future version of the Stocks data type feature.


