Projects are temporary undertakings to create a unique product or service. The idea of time is inherent to the very definition of a project in that all projects are temporary. Even though they may seem to last forever, sooner or later they must end. Adequate planning of the temporary project can predict when a project will end. Within this short, limited time, the project manager must create something: a product or a service. The creation is about changeand change, as you may have guessed, takes time.
Time management relies on several inputs to monitor and control the project schedule .
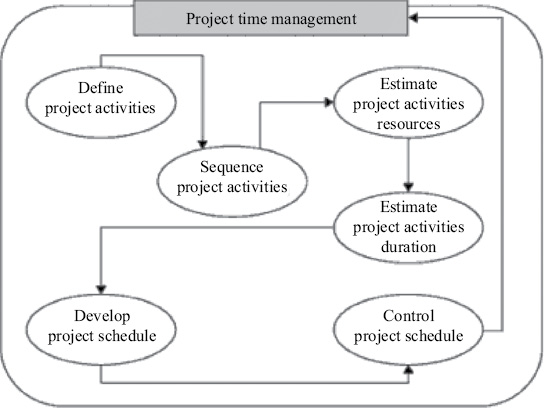
Figure 1.1. Time management process.
Source : http://wdb.fh-sm.de/PmTimeCostQuality
Creation of the product or service comes about due to the work the project team completes. The sum of the time of the work equates to when the project is completed. In addition to the duration of activities, there are other factors of time to consider, such as the following:
- Project management activities
- Planning processes
- The sequence of activities
- Procurement
- Reliance on internal and external events
- Known and unknown events affecting the project
Now that the activity list has been created, the activities must be arranged in a logical sequence. This process calls on the project manager and the project team to identify the logical relationships between activities and the preferred relationship between those activities. This can be accomplished in a few different ways.
The precedence diagramming method (PDM) is the most common method of arranging the project work visually. The PDM puts the activities in boxes, called nodes, and connects the boxes with arrows. The arrows represent the relationship and the dependencies of the work packages. The following illustration shows a simple network diagram using PDM.
Relationships between activities in a PDM constitute one of four different types:
Finish-to-start (FS) This relationship means Task A must be completed before Task B can begin.
Start-to-start (SS) This relationship means Task A must start before Task B can start. This relationship allows both activities to happen in tandem.
Finish-to-finish (FF) this relationship means Task A must complete before Task B does. Ideally, two tasks must finish at exactly the same time, but this is not always the case.
Start-to-finish (SF) This relationship is unusual and is rarely used. It requires that Task A to start so that Task B may finish.
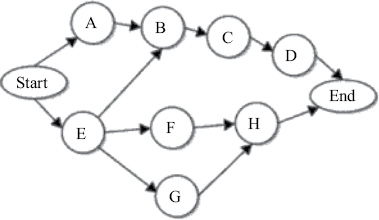
Figure 1.2. Assign the best time.
Source : http://wdb.fh-sm.de/PmTimeCostQuality
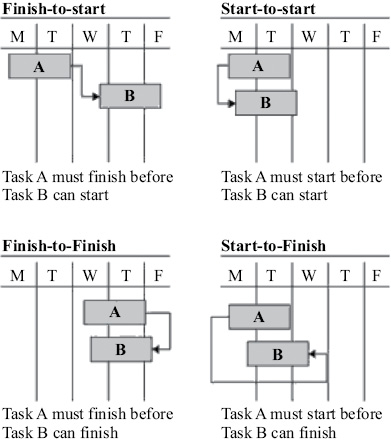
Figure 1.3. Relationships between activities.
Source : http://wdb.fh-sm.de/PmTimeCostQuality

Figure 1.4. Values added to work packages.
Source : http://wdb.fh-sm.de/PmTimeCostQuality
1.2.1 Considering Leads and Lags
Leads and lags are values added to work packages to slightly alter the relationship between two or more work packages. Lead time is considered a negative value because time is subtracted from the downstream activity to bring successor activities closer to the start of the project.
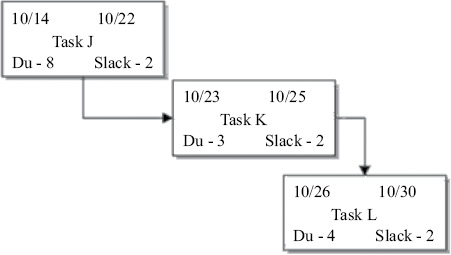
Figure 1.5. Activities sequencing.
Source : http://wdb.fh-sm.de/PmTimeCostQuality
1.2.2 Examining the Sequencing Outputs
There are many approaches to using activity sequencing: a project manager and the project team can use software programs, the approach can be done manually, or the team can manually do the scheduling and then transfer the schedule into a PMIS. Whichever method is selected, the project manager must remember four things.
- Only the required work should be scheduled.
- Finish-to-start relationships are the most common and preferred .
- Activity sequencing is not the same as a schedule.
- Scheduling comes after activity sequencing.
A project network diagram (PND) illustrates the flow of the project work and the relationship between the work packages. PNDs are typically activity on node (AON), and most PMIS packages use the PDM method. The following illustration is a typical example of a network diagram.
1.2.3 Considering the Resource Requirements
The identified resource requirements will affect the project schedule. Remember the difference between duration and effort? Duration is how long the activity will take, while effort is the labor applied to the task.
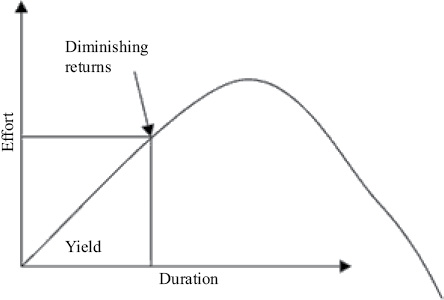
Figure 1.6. Project duration of estimating.
Source : http://wdb.fh-sm.de/PmTimeCostQuality
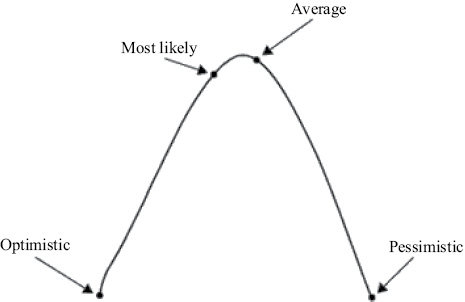
Figure 1.7. Three-key point estimating.
Source : http://wdb.fh-sm.de/PmTimeCostQuality
1.2.4 Estimating Activity Durations
Activity duration estimates, like the activity list and the work breakdown structure(WBS) dont come from the project managerthey come from the people completing the work. They may also undergo progressive elaboration. In this section, we examine the approach to completing activity duration estimates, the basis of estimates, and the allowance for activity list updates.
How confident can a project manager be when it comes to estimating? If the project work has been done before in past projects, the level of confidence in the duration estimate is probably high. But if the work has never been done before, there are lots of unknownsand with that comes risk. To mitigate the risk, the project manager can use a three-point estimate. A three-point estimate requires that for each activity, optimistic, most likely, and pessimistic time estimates be created.
(Optimistic time + (4 Most likely time) + Pessimistic time) / 6
1.3.1 Float
It is better to describe Float here. The Float, also called as Slack, is the amount of time that an activity can be delayed without causing project delays or causing delays in other activities. There are three types of float. Lets review them one by one.
Total Float: Total Float is the amount of time an activity can be delayed without delaying the project end date or an intermediary milestone. Lets consider that a project activity is not on the critical path. Since it is not on the critical path, delay on this activity can be compensated. But there is a limit here. If it is delayed too much, you will exceed the critical path duration and this will cause project delay. Float here helps you to see how long you can delay an activity, without affecting the project duration.
Free float: Free float is the amount of time an activity can be delayed without delaying the early start date . Early start date of an activity shows the earliest data that an activity can be started; because, an activity will depend on other activities, constraints, and so on. Therefore, it will have an early start date. And free float is the amount of time that an activity can be delayed, without delaying the early start date.
Project Float: This is the amount of time an activity can be delayed without delaying externally imposed project completion date.
Next page
