Kevin Bailey - Candlestick Trading: A Comprehensive Beginners Guide to Learn the Realms of Candlestick Trading from A-Z
Here you can read online Kevin Bailey - Candlestick Trading: A Comprehensive Beginners Guide to Learn the Realms of Candlestick Trading from A-Z full text of the book (entire story) in english for free. Download pdf and epub, get meaning, cover and reviews about this ebook. genre: Business. Description of the work, (preface) as well as reviews are available. Best literature library LitArk.com created for fans of good reading and offers a wide selection of genres:
Romance novel
Science fiction
Adventure
Detective
Science
History
Home and family
Prose
Art
Politics
Computer
Non-fiction
Religion
Business
Children
Humor
Choose a favorite category and find really read worthwhile books. Enjoy immersion in the world of imagination, feel the emotions of the characters or learn something new for yourself, make an fascinating discovery.

- Book:Candlestick Trading: A Comprehensive Beginners Guide to Learn the Realms of Candlestick Trading from A-Z
- Author:
- Genre:
- Rating:5 / 5
- Favourites:Add to favourites
- Your mark:
Candlestick Trading: A Comprehensive Beginners Guide to Learn the Realms of Candlestick Trading from A-Z: summary, description and annotation
We offer to read an annotation, description, summary or preface (depends on what the author of the book "Candlestick Trading: A Comprehensive Beginners Guide to Learn the Realms of Candlestick Trading from A-Z" wrote himself). If you haven't found the necessary information about the book — write in the comments, we will try to find it.
If this sounds like you, keep reading!
Its hard to know where to start, as a retail investor. Theres plenty of terms, and words, out there for what youre looking for, but its a slog to have to sift through and figure out what you need to know.
One thing that circles around is the concept of candlestick trading in the forex market. But what does it mean?
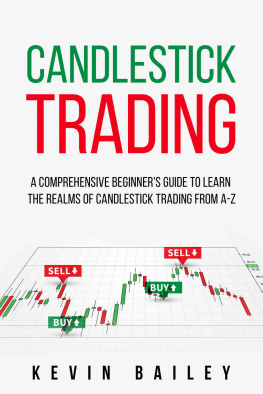
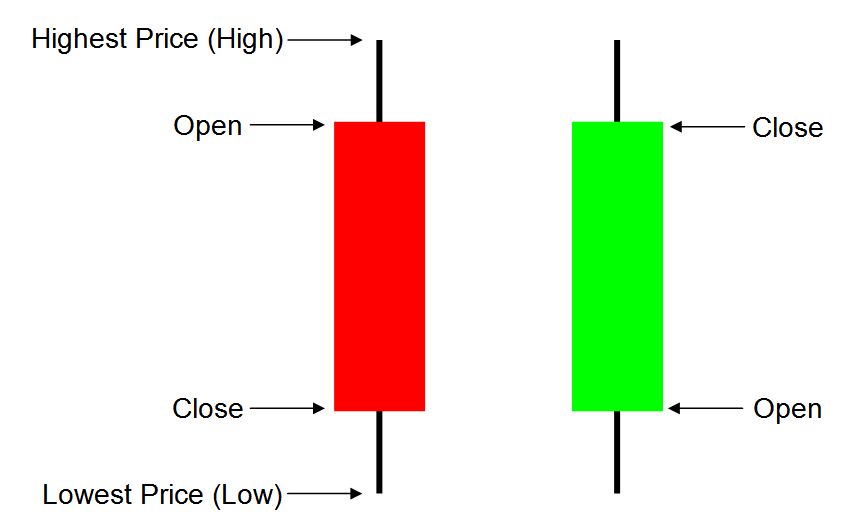
In the forex market, candlestick trading is a prominent method of technical analysis. Forex candlestick trading is used by both experienced and novice traders. This trading approach can be quite profitable if you can recognize market price trends and position your transactions correctly. Candlesticks are used to chart price movement by presenting the high, low, open, and close prices for the selected time period. Depending on whether the candlestick ends higher or lower than the initial price, it will be colored differently, commonly red or green, with red denoting a down candle and green denoting a higher candle.
The following are some of the things youll learn in this book:
- What exactly is Candlestick Trading;
- What are the common patterns to follow in Candlestick Trading;
- A Beginners guide to bullish and bearish patterns;
- How do you know when to buy and when to sell, and following trends;
- Two-pattern candles, three-pattern candles, and other patterns you should keep an eye on;
- What it means to trade binary patterns in candlestick, and other technical terms youll need to know;
- Mistakes beginners always make, and how to avoid them;
AND SO MUCH MORE!
It doesnt matter if this is your first foray into the trading world, or if youre venturing into new means of passive income in the market; Candlestick is regarded as one of the most effective and successful trading methods, but only when done correctly.
But thats the question, right? How to do it correctly, how you can start making real money with candlestick trading? If this is on your mind, if you have questions and dont know where to start then this book was made for you! Full of common mistakes, advise, and best practices look no further, help is here and ready for you.
So dont waste another minute! Scroll up, hit BUY NOW - learn today so you can earn tomorrow!
Kevin Bailey: author's other books
Who wrote Candlestick Trading: A Comprehensive Beginners Guide to Learn the Realms of Candlestick Trading from A-Z? Find out the surname, the name of the author of the book and a list of all author's works by series.

Candlestick Trading: A Comprehensive Beginners Guide to Learn the Realms of Candlestick Trading from A-Z — read online for free the complete book (whole text) full work
Below is the text of the book, divided by pages. System saving the place of the last page read, allows you to conveniently read the book "Candlestick Trading: A Comprehensive Beginners Guide to Learn the Realms of Candlestick Trading from A-Z" online for free, without having to search again every time where you left off. Put a bookmark, and you can go to the page where you finished reading at any time.
Font size:
Interval:
Bookmark:

CANDLESTICK TRADING
A COMPREHENSIVE BEGINNERS GUIDE TO LEARN THE REALMS OF CANDLESTICK TRADING FROM A-Z


Table of Contents
Copyright 2021 by Kevin Bailey
All Rights Reserved.
No Part of this book may be reproduced in any form or by any electronic or mechanical means, including information storage and retrieval systems, without written permission from the author, except for the use of brief quotations in a book review.
INTRODUCTION
In comparison to a line chart, bar chart, or point and figure chart, candlesticks are the most preferred chart among traders. It has gained appeal among traders since it visually provides a wide range of trading information in one go. Candlestick charts are also easy to understand and read. It is made up of two parts: the body (rectangle component of the candle) and the shadow (wicks) (lines above or below the body). Each candlestick also has a price for the open, high, low, and close. The timeframe of the candlestick chart is set by the trader based on his trading horizon.
Many technical analysis patterns and trends are named for the shapes they resemble when viewed in chart form. Many people believe that this is the simplest form of technical analysis chart to interpret for beginners. New investors must understand the meaning of each piece of chart data. The primary section of the candlestick's shape is known as the body or actual body, and it can be solid or hollow in either case. Long, narrow lines are always tied to bodies at the top and bottom, and these are known as shadows, wicks, or tails. Typically, the shadow represents the stock's peak and low price ranges.
If you wanted to make a candlestick chart without using a computer tracking program, you'd need a data set containing the daily open, low, high, and close values for each period of time you wanted to study, whether it was a single day, a week, or a year. Once you have this information, you can start recording it on the chart in the form of candlestick shapes so that you may conduct a more thorough analysis. If a stock finished at a price that was greater than its opening price, you would draw a candlestick with a hollow body. The opening price would be represented by the bottom edge of the body, while the closing price would be represented by the top edge of the body. If you knew the stock had closed at a lower price than it had opened, you'd draw a filled candlestick with the top of the body representing the opening price and the bottom of the body representing the closing price.
To perform technical analysis on a stock, technical analysts need the least amount of data feasible. Candlestick charting is easy to understand and analyze while also providing information on the stock's open, close highs and lows, as well as the level of activity. The candles used in the charts, on the other hand, resemble a candle with a wick at each end. The wicks are usually referred to as shadows, while the full body of the candle is referred to as the true body. Each day might be represented by a candle on the chart. The open and close prices are shown at the top and bottom of the candle's body, while the highs and lows of the stock are shown in the shadows.
The candles can be black or white, or even red and green in some charts. When a candle is black or red, it means the stock closed lower than it opened. If it's white or green, that means the stock closed higher than where it started. The length of the candle body indicates how much trading activity the stock experienced throughout the day. The many permutations that the candles can display provide significant information to the investor. This is why candlestick charts are the most widely used technical analysis tool. This book will teach you all you need to know about candlestick trading and how to trade like an expert.
CHAPTER ONE
WHAT IS CANDLESTICK TRADING?
Before I go into detail about candlestick trading, I think it's only fair to discuss candlestick charts and how they came to be.
When employed appropriately, the combined power of western technical and candlestick analysis is a force to be reckoned with when evaluating a possible trade. Although candlestick trading tactics have only lately become popular in the western trading industry (since the 1980s), the Japanese have been using them to trade rice contracts for hundreds of years. Candlestick patterns indicate who is in the power of the current market in an instant and visually, i.e., "bulls or bears."
Candlestick charting is a type of charting that is similar to a bar chart in that it is used to examine supply and demand. The candlestick chart displays the same information as the bar chart, but it concentrates on the relationship between opening and closing prices. The candlestick approach is beneficial to investors because it allows them to perceive prices from a different perspective, and many investors find it easier to read.
Candlestick patterns should never be traded on their own, no matter how appealing the situation appears to be. Candlestick patterns are quite good at predicting price reversals in advance, but they don't tell you how big the reversal will be. Western technical indicators usually play a significant role in the final decision, guiding the trader in deciding whether or not to follow the reversal shown by the candlestick pattern.
Traders use technical analysis to seek for different trading signals to enter a trade when the price is overbought or oversold. Traders use candle patterns to identify early price reversals. However, there is a powerful candlestick pattern that is rarely discussed, and many traders fail to see it when signal trading or doing trade analysis. The "inner candle reversal pattern" is what it's called.
A candle that forms inside the previous candle is known as an inside candle. The highs and lows of an inside candle must never surpass those of the previous candle; nevertheless, this powerful reversal pattern is only acceptable if it occurs quickly after an overbought or oversold position has arisen; otherwise, inside candlestick trading is not recommended.
Trading with candlesticks gives distinct visual indicators that make reading price action much easier. Speculators can better understand market mood by selling and buying with Japanese Candle Charts. Candlesticks emphasize a good way to the relationship between close price and open price, providing more depth of information than typical bar charts, which focus on the high and low. Candlestick traders can more quickly recognize various types of price action that tend to foretell trend reversals or continuations, which is one of the most difficult aspects of trading. When combined with other technical analysis tools, Candlestick pattern analysis can be a very useful tool for determining entry and exit locations. The body of a candlestick represents the difference between the open and closing price. Its hue (typically red for down and blue for up) indicates whether the market closed up or down for the day (or week, or year). The wicks (or shadows) identify the currency's extremely low and high prices on a given day.
Next pageFont size:
Interval:
Bookmark:
Similar books «Candlestick Trading: A Comprehensive Beginners Guide to Learn the Realms of Candlestick Trading from A-Z»
Look at similar books to Candlestick Trading: A Comprehensive Beginners Guide to Learn the Realms of Candlestick Trading from A-Z. We have selected literature similar in name and meaning in the hope of providing readers with more options to find new, interesting, not yet read works.
Discussion, reviews of the book Candlestick Trading: A Comprehensive Beginners Guide to Learn the Realms of Candlestick Trading from A-Z and just readers' own opinions. Leave your comments, write what you think about the work, its meaning or the main characters. Specify what exactly you liked and what you didn't like, and why you think so.