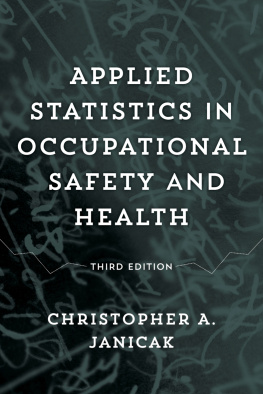
Janicak - Applied statistics in occupational safety and health
Here you can read online Janicak - Applied statistics in occupational safety and health full text of the book (entire story) in english for free. Download pdf and epub, get meaning, cover and reviews about this ebook. year: 2017, publisher: Bernan Press, genre: Children. Description of the work, (preface) as well as reviews are available. Best literature library LitArk.com created for fans of good reading and offers a wide selection of genres:
Romance novel
Science fiction
Adventure
Detective
Science
History
Home and family
Prose
Art
Politics
Computer
Non-fiction
Religion
Business
Children
Humor
Choose a favorite category and find really read worthwhile books. Enjoy immersion in the world of imagination, feel the emotions of the characters or learn something new for yourself, make an fascinating discovery.
- Book:Applied statistics in occupational safety and health
- Author:
- Publisher:Bernan Press
- Genre:
- Year:2017
- Rating:5 / 5
- Favourites:Add to favourites
- Your mark:
- 100
- 1
- 2
- 3
- 4
- 5
Applied statistics in occupational safety and health: summary, description and annotation
We offer to read an annotation, description, summary or preface (depends on what the author of the book "Applied statistics in occupational safety and health" wrote himself). If you haven't found the necessary information about the book — write in the comments, we will try to find it.
Janicak: author's other books
Who wrote Applied statistics in occupational safety and health? Find out the surname, the name of the author of the book and a list of all author's works by series.
Applied statistics in occupational safety and health — read online for free the complete book (whole text) full work
Below is the text of the book, divided by pages. System saving the place of the last page read, allows you to conveniently read the book "Applied statistics in occupational safety and health" online for free, without having to search again every time where you left off. Put a bookmark, and you can go to the page where you finished reading at any time.
Font size:
Interval:
Bookmark:
Applied Statistics in Occupational Safety and Health
Applied Statistics in Occupational Safety and Health
Third Edition
Christopher A. Janicak
BERNAN
Lanham Boulder New York London
Published by Bernan Press
An imprint of The Rowman & Littlefield Publishing Group, Inc.
4501 Forbes Boulevard, Suite 200, Lanham, Maryland 20706
www.rowman.com
800-865-3457; info@bernan.com
Unit A, Whitacre Mews, 26-34 Stannary Street, London SE11 4AB
Copyright 2017 by Bernan Press
All rights reserved . No part of this book may be reproduced in any form or by any electronic or mechanical means, including information storage and retrieval systems, without written permission from the publisher, except by a reviewer who may quote passages in a review.
British Library Cataloguing in Publication Information Available
Library of Congress Cataloging-in-Publication Data Available
ISBN: 978-1-59888-888-1 (paper)
ISBN: 978-1-59888-889-8 (electronic)
 The paper used in this publication meets the minimum requirements of American National Standard for Information SciencesPermanence of Paper for Printed Library Materials, ANSI/NISO Z39.48-1992.
Printed in the United States of America
Contents
FIGURES
TABLES
This book was written with the safety professional in mind. Safety professionals encounter statistics in the literature they read, such as business reports, and so on, and may be required to present findings or make decisions based on data analyses. Statistics can be used to justify the implementation of a program, identify areas that need to be addressed, or justify the impact that various safety programs have on losses and accidents. Safety professionals also use a variety of data in their day-to-day work. For example, the number of accidents reported in a given time frame may give an indication of the performance of a safety program; the amount of money paid out in losses may indicate the severity of the accidents and safety professionals are also required to interpret existing studies and statistics. They must be able to determine whether the results and conclusions are valid and whether the procedures have been used in an appropriate manner.
In process safety management, the identification and evaluation of hazardous operations can be directed back to the probabilities of failures to the components, subsystems, and systems in question. Statistical analyses are necessary to make these determinations. In the workplace, exposure to various chemicals and materials can result in increased risk for illness, which again is measured in terms of probabilities.
This book is designed to provide the people that are preparing to become practicing safety professionals or those already practicing in the field with the basic methods and principles necessary to apply statistics properly. It presents the reader with descriptive statistical concepts and how these concepts can be used to summarize data. Inferential statistics for parametric and nonparametric procedures will be presented using a systematic approach. Although the tests and hypotheses are different, the same basic steps can be followed for both types of procedures.
Statistics are defined as a set of mathematical techniques used by social scientists to manipulate and analyze data for the purposes of answering questions and testing theories (Healey 2009, 1).
The field of statistics can be broadly classified as descriptive statistics and inferential statistics (Witte and Witte 2009, 5). Descriptive statistics provides us with tools for organizing and summarizing the inevitable variability in collections of actual observations or scores (Witte and Witte 2009, 5). Examples of descriptive statistics include means, percentages, and frequencies. Descriptive statistics are used to describe the characteristics of a sample and are usually used in the first stages of data analysis.
Inferential statistics , on the other hand, uses the results from a subset or sample to infer the results to a larger group or population (Witte and Witte 2009, 5). Statistical procedures allow us to make this jump from results from a smaller group to a larger population by incorporating degrees of probability into the results. If done properly, the researcher can take measurements from a sample and, with a certain degree of confidence, be assured of similar results to those that would have been found if the entire population had been measured. The field of statistics provides the rules and procedures that must be followed to be able to accurately generalize the results from a sample to a much larger population.
The field of statistics uses some common terminology and symbols. Statistical notation uses Greek letters and algebraic symbols to convey meaning about the procedures that one should follow to complete a particular test. For the most part, the letters and symbols are consistent in the discipline. The first major delineation between the symbols occurs when the data being analyzed represent a population or a sample. A population signifies that one has measured a characteristic for everyone or everything that belongs to that particular group. For example, if one wishes to measure a characteristic on the population defined as safety managers, one would have to go and get a measure of that characteristic for every safety manager possible. In many cases, measuring a population is quite difficult, if not impossible. In statistics, we most often obtain data from a sample and use the results from the sample to describe the whole population. In the example described above, the researcher may go and measure a characteristic from a selected group of safety managers. When the researcher does this, he is using a sample.
A member of a population or a sample is referred to as a subject or a case. As will be discussed later in this book, there are statistical methods for determining the number of cases that must be selected to have a sound study. For each case, the measurements taken for the purposes of statistical analysis are considered data. Data are the recorded observations gathered for the purposes of a statistical study.
In a study, the researcher will be collecting a variety of information and taking many measurements for data analysis. The measurements can be classified as either qualitative or quantitative (Witte and Witte 2009, 9). If the measurements deal with characteristics about the individual or subject, they are qualitative. Additional examples of qualitative measures include the gender of a person or the color of a sign. For the purposes of data analysis, qualitative measures are coded with numbers. For example, 1 may represent male and 2 may represent female.
Quantitative measures are measures that describe a characteristic in terms of a number. Quantitative measures can be the age of a person measured in years or the number of accidents an organization had over the previous year.
When a statistician uses notations to describe the statistical tests, procedures, or results, the format of the notation signifies whether the statistician is dealing with a population or a sample. Statistical notation for a population is written using Greek letters, while statistical notation for a sample is written using English letters. summarizes some of the more common statistical terms that will be used in this book.
There are also statistical terms that signify mathematical procedures to be performed on the data. For example, the Greek letter instructs the statistician to sum or add up the terms. Some of the more common procedural terms used in this book are in .
All statistical tests and procedures begin with a question the researcher wishes to answer. The questions can be as simple as What is the average age of the injured person? to Is there a significant relationship between exposure to a chemical and cancer? The questions can be answered with descriptive statistics or can be tested with inferential statistics. When researchers ask a question that is tested with statistics, they have developed a hypothesis. Researchers use statistics to confirm or reject the hypothesis being tested.
Next pageFont size:
Interval:
Bookmark:
Similar books «Applied statistics in occupational safety and health»
Look at similar books to Applied statistics in occupational safety and health. We have selected literature similar in name and meaning in the hope of providing readers with more options to find new, interesting, not yet read works.
Discussion, reviews of the book Applied statistics in occupational safety and health and just readers' own opinions. Leave your comments, write what you think about the work, its meaning or the main characters. Specify what exactly you liked and what you didn't like, and why you think so.

