• Complain

Lisa Healey - Intermediate Algebra

Here you can read online Lisa Healey - Intermediate Algebra full text of the book (entire story) in english for free. Download pdf and epub, get meaning, cover and reviews about this ebook. year: 2017, publisher: Chemeketa Press, genre: Children. Description of the work, (preface) as well as reviews are available. Best literature library LitArk.com created for fans of good reading and offers a wide selection of genres:

Romance novel Science fiction Adventure Detective Science History Home and family Prose Art Politics Computer Non-fiction Religion Business Children Humor

Choose a favorite category and find really read worthwhile books. Enjoy immersion in the world of imagination, feel the emotions of the characters or learn something new for yourself, make an fascinating discovery.

Lisa Healey Intermediate Algebra
  • Book:
    Intermediate Algebra
  • Author:
  • Publisher:
    Chemeketa Press
  • Genre:
  • Year:
    2017
  • Rating:
    5 / 5
  • Favourites:
    Add to favourites
  • Your mark:
    • 100
    • 1
    • 2
    • 3
    • 4
    • 5

Intermediate Algebra: summary, description and annotation

We offer to read an annotation, description, summary or preface (depends on what the author of the book "Intermediate Algebra" wrote himself). If you haven't found the necessary information about the book — write in the comments, we will try to find it.

This exciting new text is designed for use in the third course of a year-long precollege algebra sequence. It is written with plain language, annotated examples, and practice exercises so that even students who dont care for math will understand these ideas and learn how to apply them.

Lisa Healey: author's other books


Who wrote Intermediate Algebra? Find out the surname, the name of the author of the book and a list of all author's works by series.

Intermediate Algebra — read online for free the complete book (whole text) full work

Below is the text of the book, divided by pages. System saving the place of the last page read, allows you to conveniently read the book "Intermediate Algebra" online for free, without having to search again every time where you left off. Put a bookmark, and you can go to the page where you finished reading at any time.

Light

Font size:

Reset

Interval:

Bookmark:

Make
Contents
Page List
Guide
Intermediate Algebra by Lisa Healey Intermediate Algebra ISBN - photo 1
Intermediate Algebra
by Lisa Healey Intermediate Algebra ISBN: 978-1-943536-30-6 Edition 1.2 Fall 2018 2018, Chemeketa Community College. All rights reserved. Chemeketa Press Chemeketa Press is a nonprofit publishing endeavor at Chemeketa Community College. Working together with faculty, staff, and students, we develop and publish affordable and effective alternatives to commercial textbooks. All proceeds from the sale of this book will be used to develop new textbooks. Publisher: Tim Rogers Managing Editor: Steve Richardson Production Editor: Brian Mosher Manuscript Editors: Steve Richardson, Matt Schmidgall Design Editor: Ronald Cox IV Cover Design: Ronald Cox IV Interior Design: Ronald Cox IV, Kristi Etzel, Kristen MacDonald Layout: Noah Barrera, Matthew Sanchez, Faith Martinmaas, Emily Evans, Shaun Jaquez, Steve Richardson, Kristi Etzel, Cierra Maher, Candace Johnson Additional contributions to the design and publication of this textbook come from the students and faculty in the Visual Communications program at Chemeketa. Chemeketa Math Faculty The development of this text and its accompanying MyOpenMath classroom has benefited from the contributions of many Chemeketa math faculty in addition to the author, including: Ken Anderson, Benjamin Gort, Kyle Katsinis, Tim Merzenich, Nolan Mitchell, Martin Prather, Keith Schloeman, Rick Rieman, and Toby Wagner Text Acknowledgment This book was originally developed using materials from OpenStax College Algebra, by OpenStax College, which have been made available under a Creative Commons Attribution 4.0 license and may be downloaded for free from cnx.org/contents/9b08c294-057f-4201-9f48-5d6ad992740d. Chemeketa Math Faculty The development of this text and its accompanying MyOpenMath classroom has benefited from the contributions of many Chemeketa math faculty in addition to the author, including: Ken Anderson, Benjamin Gort, Kyle Katsinis, Tim Merzenich, Nolan Mitchell, Martin Prather, Keith Schloeman, Rick Rieman, and Toby Wagner Text Acknowledgment This book was originally developed using materials from OpenStax College Algebra, by OpenStax College, which have been made available under a Creative Commons Attribution 4.0 license and may be downloaded for free from cnx.org/contents/9b08c294-057f-4201-9f48-5d6ad992740d.

Printed in the United States of America.

Contents
CHAPTER 1
Graphs and Linear Functions
Toward the end of the twentieth century, the values of stocks of Internet and technology companies rose dramatically. As a result, the Standard and Poors stock market average rose as well. tracks the value of an initial investment of just under $100 over 40 years. It shows an investment that was worth less than $500 until about 1995 skyrocketed up to almost $1500 by the beginning of 2000. That five-year period became known as the dot-com bubble because so many Internet startups were formed.

The dot-com bubble eventually burst. Many companies grew too fast and then suddenly went out of business. The result caused the sharp decline represented on the graph beginning around the year 2000.

Figure 1 Notice as we consider this example there is a relationship between - photo 2
Figure 1. Notice, as we consider this example, there is a relationship between the year and stock market average. For any year, we choose we can estimate the corresponding value of the stock market average.

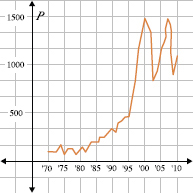
Analyzing this graph allows us to observe the relationship between the stock market average and years in the past. In this chapter, we will explore the nature of the relationship between two quantities.

1.1 Qualitative Graphs
Overview
In this section, we will see that, even without using numbers, a graph is a mathematical tool that can describe a wide variety of relationships. For example, there is a relationship between outdoor temperatures over the course of a year and the retail sales of ice cream. We can describe this relationship in a general way using a qualitative graph. As you study this section, you will learn to: Read and interpret qualitative graphs Identify independent and dependent variables Identify and interpret an intercept of a graph Identify increasing and decreasing curves Sketch qualitative graphs
A.

Reading a Qualitative Graph

Both qualitative and quantitative graphs can have two axes and show the relationship between two variables. We also read both types of graph from left to right just like a sentence. The difference is that quantitative graphs have numerical increments on the axes (scaling and tick marks), while qualitative graphs only illustrate the general relationship between two variables. Example 1 Use the qualitative graph, , to answer the following questions.
Figure 1 The sale of ice cream at Joes Caf a qualitative graph Figure 2 - photo 3
Figure 1.
Figure 2 The population of Portland Oregon a quantitative graph What does - photo 4
Figure 2.
Figure 2 The population of Portland Oregon a quantitative graph What does - photo 4
Figure 2.

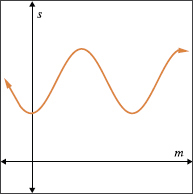
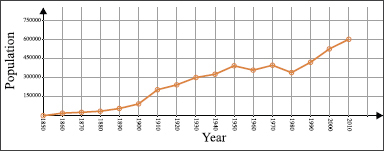
The population of Portland, Oregon (a quantitative graph). What does the qualitative graph tell us about ice cream sales at Joes Caf? Do we know how many servings were sold in June? What does the quantitative graph tell us about the population of Portland, Oregon? What was the population in 1930? Solutions Ice cream sales are lowest at the beginning and at the end of the year and highest during the middle months. We cannot tell from this graph exactly how many servings are sold in any given month. The population of Portland, Oregon, has been increasing since 1850, except for a slight decrease in the 1950s and 1970s. The population in 1930 was about 300,000.

B.

Independent and Dependent Variables

A qualitative graph is a visual description of the relationship between two variables. The graph tells a story about how one quantity is determined or influenced by another quantity. For example, the number of calories one consumes in a week determines the number of pounds one will lose (or gain) that week. Another way to say this is that the change in a persons weight is dependent on the number of calories they consume. We can assign variables to the quantities in the relationship between calories consumed and weight. Let c be the number of calories consumed in a week and let w be the weight change in pounds of the person who is counting calories.

In this example, the quantity of weight change depends on the number of calories consumed, so we call w the dependent variable . Because the number of calories consumed determines or influences the weight change, we call c the independent variable. When creating a qualitative graph that depicts the relationship between two variables, the first step is to determine which of the variables is independent and which is dependent. Lets say we want to depict the relationship between p, the number of bushels of potatoes produced on an acre of farmland, and k, the number of kilograms of fertilizer applied to the acre. We can phrase the relationship two different ways and determine which makes the most sense. We can say, The yield of potatoes depends on the amount of fertilizer, or, The amount of fertilizer depends on the yield of potatoes.

Next page
Light

Font size:

Reset

Interval:

Bookmark:

Make

Similar books «Intermediate Algebra»

Look at similar books to Intermediate Algebra. We have selected literature similar in name and meaning in the hope of providing readers with more options to find new, interesting, not yet read works.


Reviews about «Intermediate Algebra»

Discussion, reviews of the book Intermediate Algebra and just readers' own opinions. Leave your comments, write what you think about the work, its meaning or the main characters. Specify what exactly you liked and what you didn't like, and why you think so.