Brendan Gregg - BPF Performance Tools
Here you can read online Brendan Gregg - BPF Performance Tools full text of the book (entire story) in english for free. Download pdf and epub, get meaning, cover and reviews about this ebook. year: 2019, publisher: Addison-Wesley Professional, genre: Computer / Science. Description of the work, (preface) as well as reviews are available. Best literature library LitArk.com created for fans of good reading and offers a wide selection of genres:
Romance novel
Science fiction
Adventure
Detective
Science
History
Home and family
Prose
Art
Politics
Computer
Non-fiction
Religion
Business
Children
Humor
Choose a favorite category and find really read worthwhile books. Enjoy immersion in the world of imagination, feel the emotions of the characters or learn something new for yourself, make an fascinating discovery.

- Book:BPF Performance Tools
- Author:
- Publisher:Addison-Wesley Professional
- Genre:
- Year:2019
- Rating:5 / 5
- Favourites:Add to favourites
- Your mark:
BPF Performance Tools: summary, description and annotation
We offer to read an annotation, description, summary or preface (depends on what the author of the book "BPF Performance Tools" wrote himself). If you haven't found the necessary information about the book — write in the comments, we will try to find it.
Brendan Gregg: author's other books
Who wrote BPF Performance Tools? Find out the surname, the name of the author of the book and a list of all author's works by series.


BPF Performance Tools — read online for free the complete book (whole text) full work
Below is the text of the book, divided by pages. System saving the place of the last page read, allows you to conveniently read the book "BPF Performance Tools" online for free, without having to search again every time where you left off. Put a bookmark, and you can go to the page where you finished reading at any time.
Font size:
Interval:
Bookmark:
Linux System and Application Observability
Brendan Gregg

Copyright 2020 Pearson Education, Inc.
extended BPF use cases: ... crazy stuff.
Alexei Starovoitov, creator of eBPF, Feb 2015
In July, 2014, Alexei Starovoitov visited the Netflix offices in Los Gatos, California, to discuss a fascinating new technology that he was developing: extended Berkeley Packet Filter (abbreviated as eBPF or just BPF). BPF was an obscure technology for improving packet filter performance, and Alexei had a vision of extending it far beyond packets. Alexei had been working with another network engineer, Daniel Borkmann, to turn BPF into a general-purpose virtual machine, capable of running advanced networking and other programs. It was an incredible idea. A use case that interested me was performance analysis tools, and I saw how this BPF could provide the programmatic capabilities I needed. We made an agreement: if Alexei made it connect to more than just packets, Id develop the performance tools to use it.
BPF can now attach to any event source, and has become the hot new technology in systems engineering with many active contributors. To date, I have developed and published over seventy BPF performance analysis tools, which are in use worldwide and are included by default on servers at Netflix, Facebook, and other companies. For this book, I've developed many more, and included tools from other contributors. Its my privilege to share this work from myself and others here in BPF Performance Tools, giving you practical tools that you can use for performance analysis, troubleshooting, and more.
As a performance engineer I am obsessed with using performance tools in a quest to leave no stone unturned. Blind spots in systems are where performance bottlenecks and software bugs hide. My prior work used the DTrace technology, and included my 2010 Prentice Hall book DTrace: Dynamic Tracing in Oracle Solaris, Mac OS X, and FreeBSD, where I shared the DTrace tools I had developed for those operating systems. Its exciting to now be able to share similar tools for Linux, tools which can do and see even more.
These tools can help you get the most out of your systems and applications, helping you improve performance, reduce costs, and solve software issues. They can analyze much further than traditional tools, and allow you to pose arbitrary questions of the system and get answers immediately, in production environments.
This book is about BPF tools as used primarily for observability and performance analysis, but they have other uses as well: software troubleshooting, security analysis, and more. The hardest part about learning BPF is not how to write the code: you can learn any of the interfaces in a day or so. The hard part is knowing what to do with it: what should you trace out of the many thousands of available events? This book answers that question by explaining the necessary background for performance analysis, and then analyzing many different software and hardware targets using BPF performance tools, with example output from Netflix production servers.
BPF observability is a superpower, but only because it is extending our visibility into systems and applications, and not duplicating it. For you to wield BPF efficiently, it is necessary understand when to use the traditional performance analysis tools, including iostat(1) and perf(1), and when to use BPF. This book summarizes these traditional tools as well. They may solve performance problems outright, and when they do not, they provide useful context and clues for further analysis with BPF.
As so much is covered by this book, chapters include learning objectives to guide you to the most important take-aways. This book is also used as materials for an internal Netflix training class on BPF, and includes optional exercises.
The exercises include some advanced and unsolved problems, where I have yet to see a working solution. It is possible that some of these problems are impossible to solve without kernel or application changes.
Many of the BPF tools in this book are from the BCC and bpftrace repositories, which are part of the Linux Foundation IO Visor project. These are open source and available for free, not only from the repository websites, but also packaged for various Linux distributions. I have also written many additional bpftrace tools for this book, and include their source code here.
These tools were not created to arbitrarily demonstrate various BPF capabilities: they were created to do battle in production environments. These are the tools I've needed for solving production issues beyond the current analysis toolset.
For the tools written in bpftrace, the source code has been included in the book. If you wish to modify or develop new bpftrace tools, you can learn the bpftrace language from , and learn by example from the many source code listings here. This source code also helps explain what each tool is doing, and the events they instrument. It is like including pseudocode that you can run.
The BCC and bpftrace front ends are reaching maturity, but it is possible that some future changes will cause some source code included in this book to stop working, and require updates. If the tool originates in BCC or bpftrace, check those repositories for updated versions. If the tool originated in this book, check this book's website [BIBLIOG174]. What matters most is not that the tool works, but that you know about the tool and want it to work. The hardest part with BPF tracing is knowing what to do with it; even broken tools are a source of useful ideas.
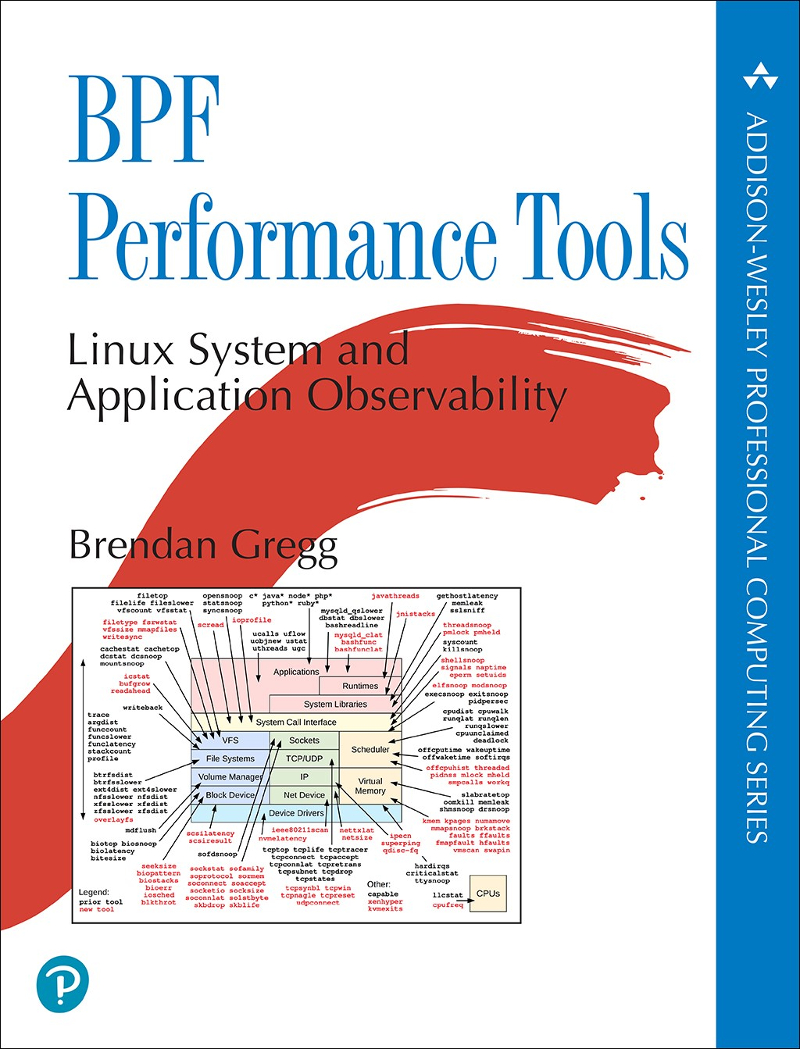
To provide you with a comprehensive set of analysis tools that double as code examples, over eighty new tools were developed for this book. Many of them are pictured in :
This diagram illustrates BPF performance tools, with tools created prior to this book colored black, and the new tools created for this book colored differently (red or gray). Both prior and new tools are covered here (later diagrams no longer use the red/black color scheme to differentiate them).
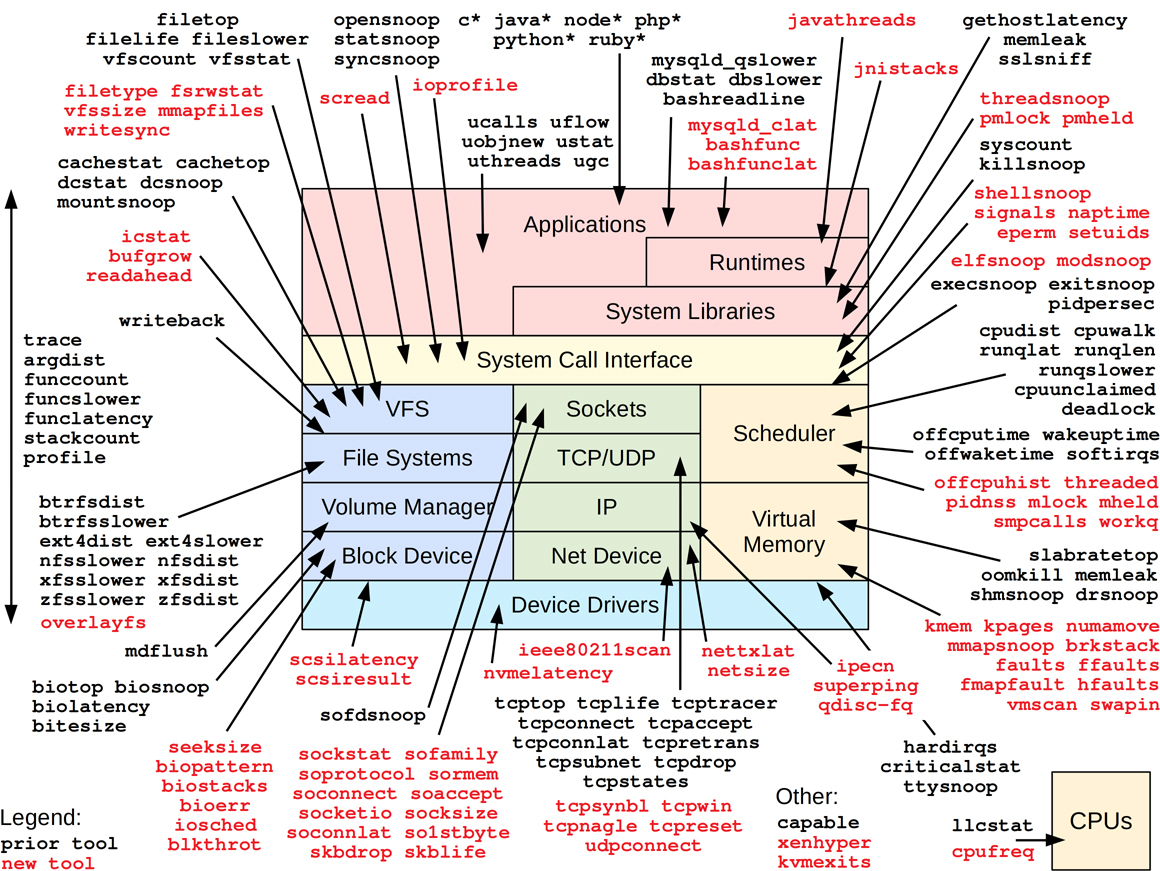
Figure 1BPF performance tools: prior and new
Some of the BCC tools have already become a source of metrics for GUIs, providing time series data for line graphs, stack traces for flame graphs, or per-second histograms for heat maps. I expect that more people will use these BPF tools via GUIs than will use the tools directly. The one common denominator is the tools themselves, so, however you end up using them, this book will explain their metrics, how to interpret them, and how to create new tools yourself.
Throughout this book, many Linux technologies are introduced, often with the kernel version number and year they appeared. Ive sometimes named the developers of the technology as well, so that you can recognize supporting materials written by the original authors.
Extended BPF was added to Linux in parts. The first part was added in Linux 3.18 in 2014, and more throughout the Linux 4.x and 5.x series since then. For the BPF tools in this book, Linux 4.9 or higher is recommended, so that sufficient capabilities are available to run them. The examples in this book are taken from Linux 4.9 to 5.2 kernels.
Font size:
Interval:
Bookmark:
Similar books «BPF Performance Tools»
Look at similar books to BPF Performance Tools. We have selected literature similar in name and meaning in the hope of providing readers with more options to find new, interesting, not yet read works.
Discussion, reviews of the book BPF Performance Tools and just readers' own opinions. Leave your comments, write what you think about the work, its meaning or the main characters. Specify what exactly you liked and what you didn't like, and why you think so.