1.2 A Brief History of Quality Control
Back in 1924, while working for the Bell Telephone Co. in solving certain problems related to the quality of some electrical components, Walter Shewhart set up the foundations of modern statistical quality control []. Until that time the concept of quality was limited to check that a product characteristic was within its design limits. Shewharts revolutionary contribution was the concept of process control. From this new perspective, a products characteristic within its design limits is only a necessarybut not a sufficientcondition to allow the producer to be satisfied with the process . The idea behind this concept is that the inherent and inevitable variability of every process can be tracked by means of simple and straightforward statistical tools that permit the producer to detect the moment when abnormal variation appears in the process. This is the moment when the process can be labeled as out of control, and some action should be put in place to correct the situation.
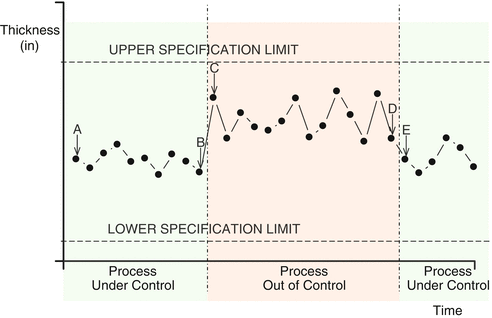
A simple example will help us understand this concept. Lets suppose a factory is producing metal plate whose thickness is a critical attribute of the product according to customer needs. The producer will carefully control the thickness of successive lots of product, and will make a graphical representation of this variable with respect to time, see Fig.. Between points A and B the process exhibits a small variability around the center of the acceptable range of values. But something happens after point C, because the fluctuation of values is much more evident, together with a shift in the average values in the direction of the Upper Specification Limit (USL) . This is the point when it is said that the process has gone out of control. After this period, the operator makes some kind of adjustments in the process (point E) that allows the process to come back to the original controlled state.
Fig. 1.1
Out of control. Example of an out-of-control process
It is worth noting that none of the points represented in this example are out of the specification limits, which means that all the production is defect-free . Although one could think that, after all, what really matters is the distinction between defects and
non-defects, an out-of-control situation of a process is highly undesirable as long as it is evident that the producer no longer controls the process and is at the mercy of chance. These ideas of statistical quality control were quickly assimilated by industry and even today, almost one century after the pioneering work of Shewhart, constitute one of the basic pillars of modern quality.
1.3 What Is Quality Control
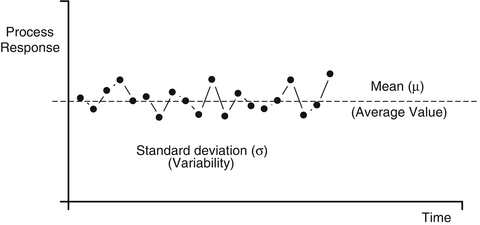
Production processes are random in nature. This means that no matter how much care one could place in the process, its response will somewhat vary with time. It is possible to classify process variability into two main categories: chance variation and assignable variation . When the variability present in a process is the result of many causes , having each of them a very small contribution of total variation, being these causes inherent to the process (i.e., impossible to be eliminated or even identified in some cases), we say that the process shows a random normal noise. This comes from the definition of a normal distribution of random values. In a normal distribution the values tend to be grouped around the average value, the farther from the average the less probable that a value may occur. When variability comes only from chance causes (also called common causes ) the behavior of the process is more predictable; no trends or patterns are present in the data (Fig.). In this case the process is said to be under control.
Fig. 1.2
Chance causes. Variability resulting from chance causes. The process is under control
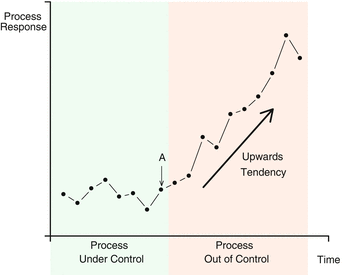
But in certain circumstances processes deviate from this kind of behavior, some of the causes responsible for the variation become strong enough as to introduce recognizable patterns in the evolution of data, i.e. step changes in the mean, tendencies, increase in the standard deviation, etc. This kind of variation is much more unpredictable than in the previous situation. This special behavior of the process is the result of a few causes, having each of them a significant contribution of total variation. These causes are not inherent to the process and are called assignable causes (also called special causes ). Fig. shows a case where a tendency is clearly observed in the data after point A. In this case the process is said to be out of control .
Fig. 1.3
Assignable causes. Variability resulting from assignable causes. The process is out of control
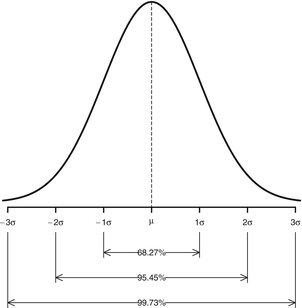
From both previous examples it becomes evident that a graphical representation of the evolution of process data with time is a powerful means of getting a first idea of the possible state of control of the process. But in order to give a final judgment over a process state of control, something more is needed. If we suppose that the process is free of assignable causes, thus assuming that the process is under control, then we would expect a behavior of the process that could be reasonably described by a normal distribution. A detailed description of the normal distribution can be consulted in Chapter . From this figure it comes out that the probability of obtaining a data point from the process whose distance to the process mean is larger than 3 is as small as 0.27%. This probability is, indeed,
Fig. 1.4
Normal distribution. Probability of a result in different regions of the normal distribution

