it-ebooks - Scipy Cookbook fix1
Here you can read online it-ebooks - Scipy Cookbook fix1 full text of the book (entire story) in english for free. Download pdf and epub, get meaning, cover and reviews about this ebook. year: 2016, publisher: iBooker it-ebooks, genre: Computer. Description of the work, (preface) as well as reviews are available. Best literature library LitArk.com created for fans of good reading and offers a wide selection of genres:
Romance novel
Science fiction
Adventure
Detective
Science
History
Home and family
Prose
Art
Politics
Computer
Non-fiction
Religion
Business
Children
Humor
Choose a favorite category and find really read worthwhile books. Enjoy immersion in the world of imagination, feel the emotions of the characters or learn something new for yourself, make an fascinating discovery.

Scipy Cookbook fix1: summary, description and annotation
We offer to read an annotation, description, summary or preface (depends on what the author of the book "Scipy Cookbook fix1" wrote himself). If you haven't found the necessary information about the book — write in the comments, we will try to find it.
it-ebooks: author's other books
Who wrote Scipy Cookbook fix1? Find out the surname, the name of the author of the book and a list of all author's works by series.


![Eli Bressert [Eli Bressert] - SciPy and NumPy](/uploads/posts/book/119331/thumbs/eli-bressert-eli-bressert-scipy-and-numpy.jpg)
Scipy Cookbook fix1 — read online for free the complete book (whole text) full work
Below is the text of the book, divided by pages. System saving the place of the last page read, allows you to conveniently read the book "Scipy Cookbook fix1" online for free, without having to search again every time where you left off. Put a bookmark, and you can go to the page where you finished reading at any time.
Font size:
Interval:
Bookmark:
This is the SciPy Cookbook a collection of various user-contributed recipes, which once lived under wiki.scipy.org. Note that some are fairly old (20052009), and may not be as relevant today. If you want to contribute additions/corrections, see the the SciPy-CookBook repository.
NOTE: you may want to use scipy.io.FortranFile instead.
Files written by Fortran programs can be written using one of two formats: formatted or unformatted. Formatted files are written in human-readable formats and it should be possible to load them using numpy.fromfile. Unformatted files are written using a binary format that is unspecified by the Fortran standard. In practice, most compilers/runtimes use a record-based format with an integer header consisting of the length of the record in bytes, then the record itself followed by an integer footer with the length of the preceeding in bytes.
Given that the precision and endian-ness of the headers and the data are unspecified, there are a large number of possible combinations that may be seen in the wild. The class can deal with a great many of these.
The following is an example of how to read a particular unformatted output file. Note the presence of the i4 elements of the dtype representing the header and the footer.
Lots of scientific code is written in FORTRAN. One of the most convenient file formats to create in FORTRAN is the so-called unformatted binary file. These files have all the disadvantages of raw binary IO - no metadata, data depends on host endianness, floating-point representation, and possibly word size - but are not simply raw binary. They are organized into records, which are padded with size information. Nevertheless, one does encounter such files from time to time. No prewritten code appears to be available to read them in numpy/scipy, but it can be done with relative ease using numpys record arrays:
>>> A = N.fromfile("/tmp/tmp_i7j_a/resid2.tmp",... N.dtype([('pad1','i4'),... ('TOA','f8'),... ('resid_p','f8'),... ('resid_s','f8'),... ('orb_p','f8'),... ('f','f8'),... ('wt','f8'),... ('sig','f8'),... ('preres_s','f8'),... ('pad3','i8'),... ('pad2','i4')]))This example is designed to read [http://www.atnf.csiro.au/research/pulsar/tempo/ref_man_sections/output.txt a file] output by [http://www.atnf.csiro.au/research/pulsar/tempo/ TEMPO]. Most of the fields, TOA up to preres_s, are fields that are present and of interest in the file. The field pad3 is either an undocumented addition to the file format or some kind of padding (it is always zero in my test file). The FORTRAN unformatted I/O adds the fields pad1 and pad2. Each should contain the length, in bytes, of each record (so the presence of the extra pad3 field could be deduced). This code ignores t
Python includes a multithreading package, threading, but pythons multithreading is seriously limited by the Global Interpreter Lock, which allows only one thread to be interacting with the interpreter at a time. For purely interpreted code, this makes multithreading effectively cooperative and unable to take advantage of multiple cores.
However, numpy code often releases the GIL while it is calculating, so that simple parallelism can speed up the code. For sophisticated applications, one should look into MPI or using threading directly, but surprisingly often ones application is embarrassingly parallel, that is, one simply has to do the same operation to many objects, with no interaction between iterations. This kind of calculation can be easily parallelized:
dft = parallel_map(lambda f: sum(exp(2.j*pi*f*times)), frequencies)The code implementing parallel_map is not too complicated, and is attached to this entry. Even simpler, if one doesnt want to return values:
def compute(n): ...do something...foreach(compute, range(100))This replaces a for loop.
See attachments for code (written by AMArchibald). [[AttachList]]
See also ParallelProgramming for alternatives and more discussion.
The code below generates the following plot:
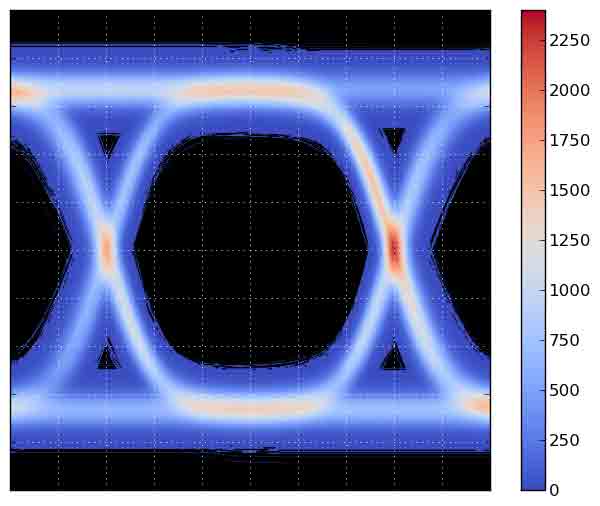
The main script generates num_traces traces, and on a grid of 600x600, it counts the number times a trace crosses a grid point. The grid is then plotted using matplotlibs imshow() function. The counting is performed using Bresenhams line algorithm, to ensure that the counting is correct, and steep parts of the curve dont result in missed counts.
Bresenhams algorithm is slow in pure Python, so a Cython version is included. If you do not build the Cython version of the Bresenham code, be sure to reduce num_traces before running the program!
Heres the main demo script, eye_demo.py.
#!pythonimport numpy as npuse_fast = Truetry: from brescount import bres_curve_countexcept ImportError: print "The cython version of the curve counter is not available." use_fast = Falsedef bres_segment_count_slow(x0, y0, x1, y1, grid): """Bresenham's algorithm. The value of grid[x,y] is incremented for each x,y in the line from (x0,y0) up to but not including (x1, y1). """ nrows, ncols = grid.shape dx = abs(x1 - x0) dy = abs(y1 - y0) sx = 0 if x0 < x1: sx = 1 else: sx = -1 sy = 0 if y0 < y1: sy = 1 else: sy = -1 err = dx - dy while True: # Note: this test is moved before setting # the value, so we don't set the last point. if x0 == x1 and y0 == y1: break if 0 <= x0 < nrows and 0 <= y0 < ncols: grid[x0, y0] += 1 e2 = 2 * err if e2 > -dy: err -= dy x0 += sx if e2 < dx: err += dx y0 += sydef bres_curve_count_slow(x, y, grid): for k in range(x.size - 1): x0 = x[k] y0 = y[k] x1 = x[k+1] y1 = y[k+1] bres_segment_count_slow(x0, y0, x1, y1, grid)def random_trace(t): s = 2*(np.random.randint(0, 5) % 2) - 1 r = 0.01 * np.random.randn() s += r a = 2.0 + 0.001 * np.random.randn() q = 2*(np.random.randint(0, 7) % 2) - 1 t2 = t + q*(6 + 0.01*np.random.randn()) t2 += 0.05*np.random.randn()*t y = a * (np.exp(s*t2) / (1 + np.exp(s*t2)) - 0.5) + 0.07*np.random.randn() return yif __name__ == "__main__": import matplotlib.pyplot as plt grid_size = 600 grid = np.zeros((grid_size, grid_size), dtype=np.int32) tmin = -10.0 tmax = 10.0 n = 81 t = np.linspace(tmin, tmax, n) dt = (tmax - tmin) / (n - 1) ymin = -1.5 ymax = 1.5 num_traces = 1000 for k in range(num_traces): # Add some noise to the times at which the signal # will be sampled. Without this, all the samples occur # at the same times, and this produces an aliasing # effect in the resulting bin counts. # If n == grid_size, this can be dropped, and t2 = t # can be used instead. (Or, implement an antialiased # version of bres_curve_count.) steps = dt + np.sqrt(0.01 * dt) * np.random.randn(n) steps[0] = 0 steps_sum = steps.cumsum() t2 = tmin + (tmax - tmin) * steps_sum / steps_sum[-1] td = (((t2 - tmin) / (tmax - tmin)) * grid_size).astype(np.int32) y = random_trace(t2) # Convert y to integers in the range [0,grid_size). yd = (((y - ymin) / (ymax - ymin)) * grid_size).astype(np.int32) if use_fast: bres_curve_count(td, yd, grid) else: bres_curve_count_slow(td, yd, grid) plt.figure() # Convert to float32 so we can use nan instead of 0. grid = grid.astype(np.float32) grid[grid==0] = np.nan plt.grid(color='w') plt.imshow(grid.T[::-1,:], extent=[0,1,0,1], cmap=plt.cm.coolwarm, interpolation='gaussian') ax = plt.gca() ax.set_axis_bgcolor('k') ax.set_xticks(np.linspace(0,1,11)) ax.set_yticks(np.linspace(0,1,11)) ax.set_xticklabels([]) ax.set_yticklabels([]) plt.colorbar() fig = plt.gcf() #plt.savefig("eye-diagram.jpg", bbox_inches='tight') plt.show()Font size:
Interval:
Bookmark:
Similar books «Scipy Cookbook fix1»
Look at similar books to Scipy Cookbook fix1. We have selected literature similar in name and meaning in the hope of providing readers with more options to find new, interesting, not yet read works.
Discussion, reviews of the book Scipy Cookbook fix1 and just readers' own opinions. Leave your comments, write what you think about the work, its meaning or the main characters. Specify what exactly you liked and what you didn't like, and why you think so.