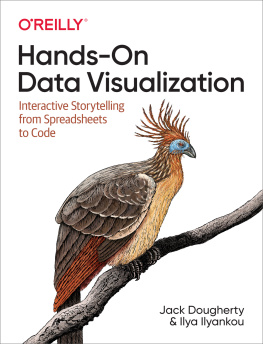
Jack Dougherty - Hands-On Data Visualization
Here you can read online Jack Dougherty - Hands-On Data Visualization full text of the book (entire story) in english for free. Download pdf and epub, get meaning, cover and reviews about this ebook. year: 2021, publisher: OReilly Media, genre: Computer. Description of the work, (preface) as well as reviews are available. Best literature library LitArk.com created for fans of good reading and offers a wide selection of genres:
Romance novel
Science fiction
Adventure
Detective
Science
History
Home and family
Prose
Art
Politics
Computer
Non-fiction
Religion
Business
Children
Humor
Choose a favorite category and find really read worthwhile books. Enjoy immersion in the world of imagination, feel the emotions of the characters or learn something new for yourself, make an fascinating discovery.
- Book:Hands-On Data Visualization
- Author:
- Publisher:OReilly Media
- Genre:
- Year:2021
- Rating:4 / 5
- Favourites:Add to favourites
- Your mark:
- 80
- 1
- 2
- 3
- 4
- 5
Hands-On Data Visualization: summary, description and annotation
We offer to read an annotation, description, summary or preface (depends on what the author of the book "Hands-On Data Visualization" wrote himself). If you haven't found the necessary information about the book — write in the comments, we will try to find it.
Hands-On Data Visualization — read online for free the complete book (whole text) full work
Below is the text of the book, divided by pages. System saving the place of the last page read, allows you to conveniently read the book "Hands-On Data Visualization" online for free, without having to search again every time where you left off. Put a bookmark, and you can go to the page where you finished reading at any time.
Font size:
Interval:
Bookmark:
by Jack Dougherty and Ilya Ilyankou
Copyright 2021 Jack Dougherty and Picturedigits Ltd. All rights reserved.
Printed in the United States of America.
Published by OReilly Media, Inc. , 1005 Gravenstein Highway North, Sebastopol, CA 95472.
OReilly books may be purchased for educational, business, or sales promotional use. Online editions are also available for most titles (https://oreilly.com). For more information, contact our corporate/institutional sales department: 800-998-9938 or corporate@oreilly.com .
Acquisitions Editor: Andy Kwan | Indexer: Sue Klefstad |
Development Editor: Amelia Blevins | Interior Designer: David Futato |
Production Editor: Katherine Tozer | Cover Designer: Karen Montgomery |
Copyeditor: Stephanie English | Illustrator: OReilly Media |
Proofreader: Piper Editorial Consulting, LLC |
- 2021-03-11: First Release
See https://oreilly.com/catalog/errata.csp?isbn=9781492086000 for release details.
The OReilly logo is a registered trademark of OReilly Media, Inc. Hands-On Data Visualization, the cover image, and related trade dress are trademarks of OReilly Media, Inc.
The views expressed in this work are those of the authors, and do not represent the publishers views. While the publisher and the authors have used good faith efforts to ensure that the information and instructions contained in this work are accurate, the publisher and the authors disclaim all responsibility for errors or omissions, including without limitation responsibility for damages resulting from the use of or reliance on this work. Use of the information and instructions contained in this work is at your own risk. If any code samples or other technology this work contains or describes is subject to open source licenses or the intellectual property rights of others, it is your responsibility to ensure that your use thereof complies with such licenses and/or rights.
978-1-492-08600-0
[LSC]
This introductory book teaches you how to tell your story and show it with data using free and easy-to-learn tools on the web. Youll discover how to design interactive charts and customized maps for your website, beginning with easy drag-and-drop tools, such as Google Sheets, Datawrapper, and Tableau Public. Youll also gradually learn how to edit open source code templates like Chart.js, Highcharts, and Leaflet on GitHub. Follow along with the step-by-step tutorials, real-world examples, and online resources. This book is ideal for students, educators, community activists, nonprofit organizations, small business owners, local governments, journalists, researchers, or anyone who wants to tell their story and show the data. No coding experience is required.
As educators, we designed this book to be accessible for new learners, to introduce key concepts in data visualization and reinforce them with hands-on examples. We assume no prior knowledge other than a basic familiarity with computers and some vague memories of secondary school mathematics. Based on feedback we received from an earlier draft, many readers across the globe have taught themselves with this book, and others educators are already using it as a textbook to teach their students.
Our subtitle, Interactive Storytelling from Spreadsheets to Code, reflects how the scope of the book progresses from strengthening basic skills to editing open source code templates, while continually maintaining our focus on telling true and meaningful data stories. We explain both the why and the how of visualization, and encourage critical thinking about how data is socially constructed and whose interests are served or ignored.
Unlike many computer books that focus on selling you a specific software application, this book introduces you to more than 20 different visualization tools, all of them free and easy to learn. We also offer guiding principles on how to make wise choices among digital tools as they continue to evolve in the future. By working through the sample datasets and tutorials, you will create more than a dozen different interactive charts, maps, and tables, and share these data stories with other readers on the public web.
Although our introductory book is comprehensive, we do not address certain advanced topics. For example, while we discuss ways to make meaningful data comparisons, we do not delve into the field of statistical data analysis. Also, we focus primarily on software tools with a friendly graphical user interface (GUI), rather than those that require you to memorize and enter command-line instructions, such as the powerful R statistics packages. Finally, while we teach readers how to modify HTML-CSS-JavaScript code templates with the Chart.js, Highcharts, and Leaflet libraries, we do not explore more advanced visualization code libraries, such as D3. Nevertheless, we believe that nearly everyone who reads this book will discover something new and valuable.
Learn by following our step-by-step tutorials on a laptop or desktop computer with an internet connection. Most of the tools introduced in the book are web-based, and we recommend you use an up-to-date version of Firefox, Chrome, Safari, or Edge browsers. We advise against using Internet Explorer as this older browser is no longer correctly supported by many web services. A Mac or a Windows computer will allow you to complete all tutorials, but if you use a Chromebook or Linux computer, you still should be able to complete most of them, and well point out any limitations in specific sections. While it may be possible to complete some tutorials on a tablet or smartphone, we dont recommend it because these smaller devices will prevent you from completing several key steps.
If youre working on a laptop, consider buying or borrowing an external mouse that plugs into your computer. Weve met several people who find it much easier to click, hover, and scroll with an external mouse than a laptops built-in trackpad. If youre new to working with computersor teaching newer users with this bookconsider starting with basic computer and mouse tutorial skills from the Goodwill Community Foundation. Also, if youre reading a digital version of this book on a laptop, consider connecting a second computer monitor or working with a tablet or second computer alongside you. This allows you to read the book on one screen and build data visualizations in the other screen.
The chapters in this book build up toward our central goal: telling true and meaningful stories with data.
The asks why data visualization matters and shows how charts, maps, and words can draw us farther into a story or deceive us from the truth.
: Foundational Skillshelps you navigate the process of sketching out your story and selecting which visualization tools you need to tell it effectively.
starts with basics and moves on to ways of organizing and analyzing data with pivot tables and lookup formulas, as well as geocoding add-on tools and collecting data with online forms.
offers concrete strategies for locating reliable information, while raising deeper questions about what data truly represents and whose interests it serves.
introduces ways to spot and fix inconsistencies and duplicates with spreadsheets and more advanced tools, and also how to create extra tables from digital documents.
provides common-sense strategies to begin analyzing and normalizing your data, while watching out for biased methods.
Font size:
Interval:
Bookmark:
Similar books «Hands-On Data Visualization»
Look at similar books to Hands-On Data Visualization. We have selected literature similar in name and meaning in the hope of providing readers with more options to find new, interesting, not yet read works.
Discussion, reviews of the book Hands-On Data Visualization and just readers' own opinions. Leave your comments, write what you think about the work, its meaning or the main characters. Specify what exactly you liked and what you didn't like, and why you think so.

