James Kalbach - Mapping Experiences: Aligning for Business Value
Here you can read online James Kalbach - Mapping Experiences: Aligning for Business Value full text of the book (entire story) in english for free. Download pdf and epub, get meaning, cover and reviews about this ebook. year: 2015, publisher: O’Reilly Media, genre: Computer. Description of the work, (preface) as well as reviews are available. Best literature library LitArk.com created for fans of good reading and offers a wide selection of genres:
Romance novel
Science fiction
Adventure
Detective
Science
History
Home and family
Prose
Art
Politics
Computer
Non-fiction
Religion
Business
Children
Humor
Choose a favorite category and find really read worthwhile books. Enjoy immersion in the world of imagination, feel the emotions of the characters or learn something new for yourself, make an fascinating discovery.

- Book:Mapping Experiences: Aligning for Business Value
- Author:
- Publisher:O’Reilly Media
- Genre:
- Year:2015
- Rating:5 / 5
- Favourites:Add to favourites
- Your mark:
Mapping Experiences: Aligning for Business Value: summary, description and annotation
We offer to read an annotation, description, summary or preface (depends on what the author of the book "Mapping Experiences: Aligning for Business Value" wrote himself). If you haven't found the necessary information about the book — write in the comments, we will try to find it.
If you want to create products and services that provide real value, you should first identify touchpointsareas where business and customer needs intersect. This practical book shows you how. Using various mapping techniques from UX design, youll learn how to turn customer observations into actionable insight for product design.
Author Jim Kalbach, Principal UX Designer with Citrix, introduces you to the principles behind alignment diagramsa class of deliverable also known as experience mappingusing several examples. Youll learn how to visually map your existing customer experience, based on user research, and demonstrate how and where customer perspectives intersect with business goals.
Using alignment diagrams, youll not only be able to orchestrate business-customer touchpoints, but also gain stakeholder support for a product or service that provides value to both your business and your customers. This book is ideal for product managers, marketers, customer experience professionals, and designers.
James Kalbach: author's other books
Who wrote Mapping Experiences: Aligning for Business Value? Find out the surname, the name of the author of the book and a list of all author's works by series.


Mapping Experiences: Aligning for Business Value — read online for free the complete book (whole text) full work
Below is the text of the book, divided by pages. System saving the place of the last page read, allows you to conveniently read the book "Mapping Experiences: Aligning for Business Value" online for free, without having to search again every time where you left off. Put a bookmark, and you can go to the page where you finished reading at any time.
Font size:
Interval:
Bookmark:
Locating Value with Alignment Diagrams
In This Chapter:
Introduction to alignment diagrams
Value-centered design
Distinguishing diagram types
Principles and benefits of alignment diagraming
There is only one valid definition of business purpose: to create a customer. Peter Drucker, in The Practice of Management (1954)
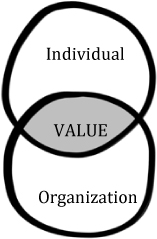
People expect some benefit when they use the products and services an organization provides. They want to get some job done, solve a problem, or experience a particular emotion. If they then perceive this benefit valuable, theyll give something in return money, time, or attention.
To survive, organizations need to capture some worth from their offerings. They need to earn profit, maximize reach, or improve their image. Value creations is bi-directional.
But how do we locate the source of value in such a relationship? Simply put, value creation lies at the intersection of human interaction with the provider of a service. Its where the experiences of individuals overlap with the offerings of an organization.
A number of years ago, I was struggling to determine which type of diagram to use on a project: a customer journey map, mental model diagram, service blueprint, or something else. After some comparison of several examples, a similar set of principles became apparent: these diagrams all represent the value creation equation in some way.
Viewing the commonalities of various diagrams opened up possibilities. I wasnt locked into one prescribed method over another. I realized the focus should not be on a specific technique, rather on the broader concept of value alignment.
More importantly, I was better able to connect the dots between human-centered design and business objectives. Focusing on alignment allowed me to talk with business leaders and stakeholders about the importance of Design in reaching their goals. Within a short time, I was running workshops with senior leaders and showing my diagrams to CEOs.
In this chapter, I introduce the concept of alignment diagrams to describe a class of diagrams that visualize the circumstances of value exchange. By the end you should have a firm grasp of value alignment, the commonalities and key differences between diagram types, and the benefits of value alignment.
The term alignment diagram refers to any map, diagram, or visualization that reveals both sides of value creation in a single overview. They are a category of diagram that illustrates the interaction between people and organizations.
Such diagrams are already used in practice. They are not new. Thus my definition of alignment diagram is less of a proposition for a specific technique than a recognition of how existing approaches can be seen in a new, constructive way.
Logically, alignment diagrams have two parts. On the one side, they illustrate aspects of the individuals experience. This is a depiction of aggregate behavior across archetypal users. On the other, alignment diagrams reflect an organizations offerings and processes. The points of interaction between the two are the means of value exchange.
You may have already used them: service blueprints, customer journey maps, experience maps, and mental model diagrams are widespread examples. The following sections compare common types of alignment diagrams to reveal their similarities.
shows a simple customer journey map of a search service for finding architects internationally. This is a modified version of a diagram I created on a project a number of years ago, concealing the name of the product and company. It describes how a customer interacts with the provider of the search service from beginning to end.
Phases of interaction are listed across the top, starting with Become Aware and going to Renew/Upgrade. The rows show various facets of the customer experience: actions, state of mind and feelings, desired outcomes, and pain points.
The bottom half shows key departmental activities to support or respond to the customer. An analysis of strengths, weakness, opportunities, and threats appears below that.
The primary means of interaction are listed in the row in the middle.
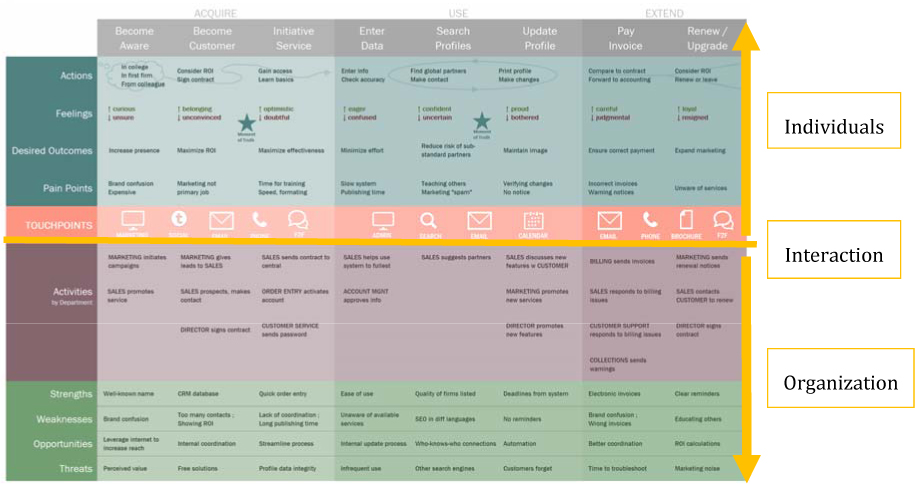
Figure 1.1: A customer journey map for a service for finding architects internationally
shows a service blueprint created by Brandon Schauer, a strategist and business analyst with Adaptive Path, a leading user experience design group. It depicts the experience of a conference attendee.
The customer actions are indicated at the top and business processes at the bottom. In the middle Schauer indicated the line of interaction" the touchpoints where there is an exchange of value.
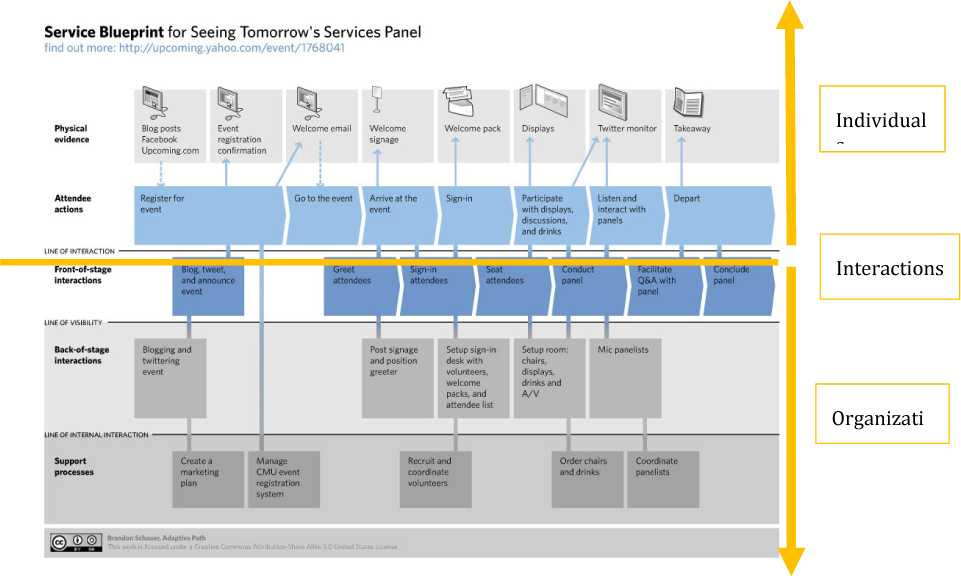
Figure 1.2: An example of a service blueprint for conference going.
shows an example of an experience map created by Chris Risdon, also of Adaptive Path. This particular map is for a service called Rail Europe, and it shows the phases in a trip through Europe by train.
It describes the experience people have when using the service in the top portion. At the bottom are opportunities for the business. The interactions between the two are embedded in the middle of the diagram.
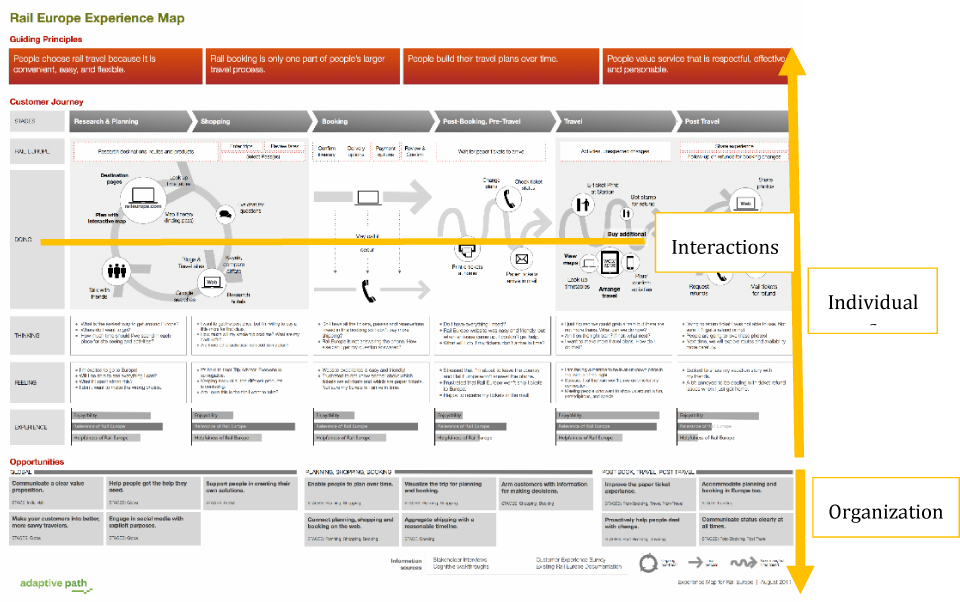
Figure 1.3: Experience map of Rail Europe created by Chris Risdon.
Another type of alignment diagram is Indi Youngs mental model" approach, detailed in her book of the same title. These are typically very large diagrams that when printed can cover an entire wall. The example in shows a close-up of mental model diagram for going to the movies.
A horizontal line in the middle divides the diagram into two parts. The top shows individual customer tasks, feelings, and philosophies. These are grouped by topic into what are called towers, which are then sectioned off into goal spaces (e.g., Choose Film and Learn More about a Film). The boxes below the center line show support for achieving those goals from various products or services.
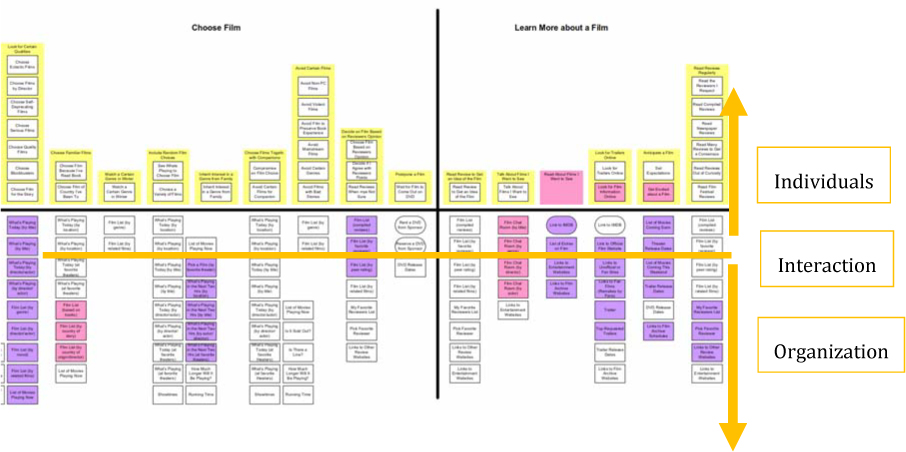
Figure 1.4: Mental model diagrams seek to hierarchically align customer behavior with business support in two halves
Unlike customer journey maps, service blueprints, or experience maps, the structure of mental model diagrams is hierarchical rather than chronological. The two-part arrangement qualifies it as an alignment diagram nonetheless.
shows an example of a spatial map. More specifically, this is a so-called isometric map created by Julia Moisand, a leading user experience designer. The three dimensional aspect of this example makes it unique from the previous examples.
On the left are rectangles, called carpets. These reflect departments and divisions in a company. Individual cards shown in the middle represent different content types and artifacts used within the system described. And on the right are users of this content, with touchpoints between the two parts.
Font size:
Interval:
Bookmark:
Similar books «Mapping Experiences: Aligning for Business Value»
Look at similar books to Mapping Experiences: Aligning for Business Value. We have selected literature similar in name and meaning in the hope of providing readers with more options to find new, interesting, not yet read works.
Discussion, reviews of the book Mapping Experiences: Aligning for Business Value and just readers' own opinions. Leave your comments, write what you think about the work, its meaning or the main characters. Specify what exactly you liked and what you didn't like, and why you think so.