Deborah Nolan - Data Science in R
Here you can read online Deborah Nolan - Data Science in R full text of the book (entire story) in english for free. Download pdf and epub, get meaning, cover and reviews about this ebook. year: 2015, publisher: CRC Press, genre: Home and family. Description of the work, (preface) as well as reviews are available. Best literature library LitArk.com created for fans of good reading and offers a wide selection of genres:
Romance novel
Science fiction
Adventure
Detective
Science
History
Home and family
Prose
Art
Politics
Computer
Non-fiction
Religion
Business
Children
Humor
Choose a favorite category and find really read worthwhile books. Enjoy immersion in the world of imagination, feel the emotions of the characters or learn something new for yourself, make an fascinating discovery.

- Book:Data Science in R
- Author:
- Publisher:CRC Press
- Genre:
- Year:2015
- Rating:3 / 5
- Favourites:Add to favourites
- Your mark:
Data Science in R: summary, description and annotation
We offer to read an annotation, description, summary or preface (depends on what the author of the book "Data Science in R" wrote himself). If you haven't found the necessary information about the book — write in the comments, we will try to find it.
Effectively Access, Transform, Manipulate, Visualize, and Reason about Data and Computation
Data Science in R: A Case Studies Approach to Computational Reasoning and Problem Solving illustrates the details involved in solving real computational problems encountered in data analysis. It reveals the dynamic and iterative process by which data analysts approach a problem and reason about different ways of implementing solutions.
The books collection of projects, comprehensive sample solutions, and follow-up exercises encompass practical topics pertaining to data processing, including:
- Non-standard, complex data formats, such as robot logs and email messages
- Text processing and regular expressions
- Newer technologies, such as Web scraping, Web services, Keyhole Markup Language (KML), and Google Earth
- Statistical methods, such as classification trees, k-nearest neighbors, and nave Bayes
- Visualization and exploratory data analysis
- Relational databases and Structured Query Language (SQL)
- Simulation
- Algorithm implementation
- Large data and efficiency
Suitable for self-study or as supplementary reading in a statistical computing course, the book enables instructors to incorporate interesting problems into their courses so that students gain valuable experience and data science skills. Students learn how to acquire and work with unstructured or semistructured data as well as how to narrow down and carefully frame the questions of interest about the data.
Blending computational details with statistical and data analysis concepts, this book provides readers with an understanding of how professional data scientists think about daily computational tasks. It will improve readers computational reasoning of real-world data analyses.
Deborah Nolan: author's other books
Who wrote Data Science in R? Find out the surname, the name of the author of the book and a list of all author's works by series.

![Jay Kreps - I [heart symbol] logs: event data, stream processing, and data integration](/uploads/posts/book/193914/thumbs/jay-kreps-i-heart-symbol-logs-event-data.jpg)
![Thomas Mailund [Thomas Mailund] - Beginning Data Science in R: Data Analysis, Visualization, and Modelling for the Data Scientist](/uploads/posts/book/119629/thumbs/thomas-mailund-thomas-mailund-beginning-data.jpg)
Data Science in R — read online for free the complete book (whole text) full work
Below is the text of the book, divided by pages. System saving the place of the last page read, allows you to conveniently read the book "Data Science in R" online for free, without having to search again every time where you left off. Put a bookmark, and you can go to the page where you finished reading at any time.
Font size:
Interval:
Bookmark:
Data Science in R: A Case Studies Approach to Computational Reasoning and Problem Solving
Deborah Nolan

CRC Press
Taylor & Francis Group
6000 Broken Sound Parkway NW, Suite 300
Boca Raton, FL 33487-2742
2015 by Taylor & Francis Group
CRC Press is an imprint of Taylor & Francis Group, an Informa business
No claim to original U.S. Government works
Version Date: DATE
International Standard Book Number-13: 978-1-4987-5987-8 (EPUB)
This book contains information obtained from authentic and highly regarded sources. Reasonable efforts have been made to publish reliable data and information, but the author and publisher cannot assume responsibility for the validity of all materials or the consequences of their use. The authors and publishers have attempted to trace the copyright holders of all material reproduced in this publication and apologize to copyright holders if permission to publish in this form has not been obtained. If any copyright material has not been acknowledged please write and let us know so we may rectify in any future reprint.
Except as permitted under U.S. Copyright Law, no part of this book may be reprinted, reproduced, transmitted, or utilized in any form by any electronic, mechanical, or other means, now known or hereafter invented, including photocopying, microfilming, and recording, or in any information storage or retrieval system, without written permission from the publishers.
For permission to photocopy or use material electronically from this work, please access www.copyright.com or contact the Copyright Clearance Center, Inc. (CCC), 222 Rosewood Drive, Danvers, MA 01923, 978-750-8400. CCC is a not-for-profit organization that provides licenses and registration for a variety of users. For organizations that have been granted a photocopy license by the CCC, a separate system of payment has been arranged.
Trademark Notice: Product or corporate names may be trademarks or registered trademarks, and are used only for identification and explanation without intent to infringe.
Visit the Taylor & Francis Web site at http://www.taylorandfrancis.com
and the CRC Press Web site at www.crcpress.com
CRC Press is a premier publisher of scientific, technology and medical content, reaching around the globe to publish the pioneering achievements of science that provide researchers, professionals, and students with the resources they need to make further advances. CRC Press is a member of Taylor & Francis Group, an informa business.
For more authoritative books in your field and for in-depth information about CRC Press books, visit www.crcpress.com
- Join our email list to receive exclusive, unadvertised discounts and alerts when new books publish in your field
- Visit Featured Authors to learn about your favorite author with detailed bios, news about their work, and discussions of their research
- Read the latest book reviews from industry experts, influencers, and thought leaders about STM (Science, Technology and Medicine) reference and textbooks
The tables in this ebook have been modified to enhance the reader experience. On compatible devices, the enhancement should keep the header rows visible as you scroll through a table.
Please report any issues with this ebook or any desired enhancements to the .
www.crcpress.com
Chapter 1
Deborah Nolan
University of California, Berkeley
Duncan Temple Lang
University of California, Davis
The growth of wireless networking has generated commercial and research interests in statistical methods to reliably track people and things inside stores, hospitals, warehouses, and factories. Global positioning systems (GPS) do not work reliably inside buildings, but with the proliferation of wireless local area networks (LANs), indoor positioning systems (IPS) can utilize WiFi signals detected from network access points to answer questions such as: where is a piece of equipment in a hospital? where am I? and who are my neighbors? Ideally, with minimal training, calibration, and equipment, these questions can be answered well in near real-time.
To build an indoor positioning system requires a reference set of data where the signal strength between a hand-held device such as a cellular phone or laptop and fixed access points (routers) are measured at known locations throughout the building. With these training data, we can build a model for the location of a device as a function of the strength of the signals between the device and each access point. Then we use this model to predict the location of a new unknown device based on the detected signals for the device. In this chapter, we examine nearly one million measurements of signal strength recorded at 6 stationary WiFi access points (routers) within a building at the University of Mannheim and develop a statistical IPS.
Our first step in this process is to understand how the data were collected and formatted. In we pursue a nearest neighbor method for predicting location and we test it on a second set of data, also provided by the researchers at Mannheim.
- string manipulation
- data structures and representation, including variable length observations
- aggregating data in ragged arrays
- exploratory data analysis and visualization
- modular functions
- debugging
- nearest neighbor methods
- cross-validation for parameter selection
Two relevant data sets for developing an IPS are available on the CRAWDAD site (. The grey circles on the plan mark the locations where the offline measurements were taken and the black squares mark 6 access points. These reference locations give us a calibration set of signal strengths for the building, and we use them to build our model to predict the locations of the hand-held device when its position is unknown.
Figure 1.1
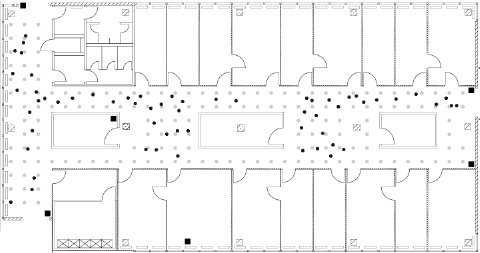
Floor Plan of the Test Environment. In this floor plan, the 6 fixed access points are denoted by black square markers, the offline/training data were collected at the locations marked by grey dots, and the online measurements were recorded at randomly selected points indicated with black dots. The grey dots are spaced one meter apart.
In addition to the ( x, y ) coordinates of the hand-held device, the orientation of the device was also provided. Signal strengths were recorded at 8 orientations in 45 degree increments (i.e., 0, 45, 90, and so on). Further, the documentation for the data indicates that 110 signal strength measurements were recorded to each of the 6 access points for every location-orientation combination.
In addition to the offline data, a second set of recordings, called the online data, is available for testing models for predicting location. In these data, 60 locations and orientations are chosen at random and 110 signals are measured from them to each access point. The test locations are marked by black dots in . In both the offline and online data some of these 110 signal strength values were not recorded. Additionally, measurements from other hand-held devices, e.g., phone or laptop, in the vicinity of the experimental unit appear in some offline records.
The documentation for the data [] describes the format of the data file. Additionally, we can examine the files ourselves with a plain text editor, and we find that each of the two files (offline and online) have the same basic format and start with something similar to
Next pageFont size:
Interval:
Bookmark:
Similar books «Data Science in R»
Look at similar books to Data Science in R. We have selected literature similar in name and meaning in the hope of providing readers with more options to find new, interesting, not yet read works.
Discussion, reviews of the book Data Science in R and just readers' own opinions. Leave your comments, write what you think about the work, its meaning or the main characters. Specify what exactly you liked and what you didn't like, and why you think so.