Springer Science+Business Media Dordrecht 2015
James J. (Jong Hyuk) Park , Yi Pan , Han-Chieh Chao and Gangman Yi (eds.) Ubiquitous Computing Application and Wireless Sensor Lecture Notes in Electrical Engineering 10.1007/978-94-017-9618-7_1
1. Voronoi Diagram and Microstructure of Weldment
Abstract
One of the famous space decomposition algorithm known as Voronoi diagram is applied to express metals microstructure for the first time by fortuitous discovery of superficial analogy of Voronoi cell and metals crystal grain. Areas of Voronoi cells are controlled by locations and the number of seed points. And it can be correlated to grain size of microstructure and nuclei numbers. Therefore grain coarsening and refinement of microstructure can be described by Voronoi tessellation for simple case. In addition to this, columnar crystal caused by rapid cooling rate in one direction is also described by anisotropic locations of seed points which can be observed in typical weldment in easy. Although it needs more profound research about correlation between crystal grain growth and Voronoi diagram control variables, it shows fairly reasonable feasibility of adopting Voronoi tesselation as metals microstructure description and prediction tool.
1.1 Introduction
Voronoi diagram, also referred as Voronoi tessellation, is famous space decomposition method in mathematics. It is simple and easy to apply. It also provides triangulation algorithm which makes triangle patches in 2D or 3D space with the given vertices to construct virtual polygon models. And the triangulation technique is known as Delaunay triangulation []. Therefore, it was very popular in the early time of computer graphics development and still quite important as basic tool. Besides the computer graphics area, the Voronoi diagram has been applied in vast area including science, technology and art.
Except for the applications in computer graphics, another popular application of Voronoi diagram in engineering is finite element simulation field [] which was a trial to express severely deformed aluminums microstructure in simple way. And it showed size reduced grain only without simulation of various grain shapes.
Microstructure of metal is composed of multiple crystal grains. And border of the grains, in other words, grain boundary determines mechanical strength in most cases. Therefore the grain size and grain boundary structure are very important features in metal component microstructure analysis. Grain boundary structure is decided by grain growth and its process is like following. Nucleus is generated at first in solidification temperature then this nucleus grows to a crystal by attaching metal or alloying elements. In rapid cooling rate, a number of nuclei are generated in simultaneous way and they grow fast then made coarse grain boundary system while relatively slow cooling rate makes fine grain boundary with less nuclei. In this viewpoint, Voronoi diagram has morphological similarity with metals microstructure, exactly speaking, grain boundary. Because Voronoi cell can be matched to crystal and grain boundary to Voronoi edge. In addition to this, seed points of Voronoi diagram play a same role of nuclei.
Microstructure formation of material is extremely complex problem since every element takes part in crystallization and chemical bonding process with respect to circumstance variable such as temperature and pressure. Therefore it is almost impossible to foresee the microstructure exactly. However, prediction of grain boundary structure has some degree of potential at least because relationship between crystal size, type, temperature and time is already known through equilibrium phase diagram and continuous cooling temperature diagram based on numerous experiments. Inspired by aforementioned morphological similarity to microstructure of metal and prediction possibility of grain boundary, Voronoi diagram is suggested as a microstructure prediction tool in this research. Final purpose and role will be visual presentation of grain boundary for given temperature history in the future but now its feasibility is tested by simulation of typical weldments microstructure for the first time.
1.2 Building Voronoi Diagram
Basic concept of Voronoi tessellation is quite simple. It just needs to compute and build equidistance separating lines between given seed points in space. For example in 2D, if there are only two seed points, just build an equidistance separation line. For more seed points over 3, circumcircle and its circumcenter should be computed for every 3 points.
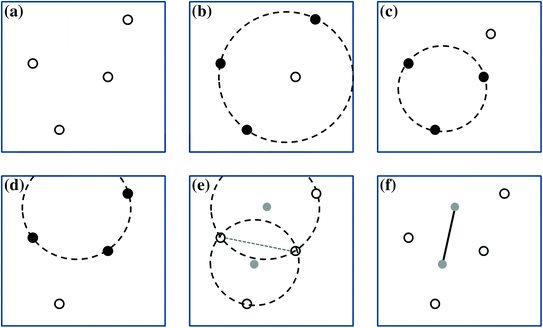
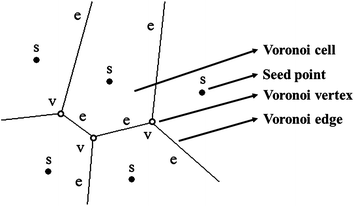
More concrete methodology of Voronoi diagram is explained through Fig. shows designation of each component in Voronoi diagram
Fig. 1.1
Voronoi diagram methodology. a Arbitrarily located 4 seed points, b selection of outer 3 points and circumcircle, c lower 3 points and circumcircle, d upper 3 points and circumcircle, e circumcenters of circumcircles, f generated Voronoi edge
Fig. 1.2
Designation of Voronoi diagram component
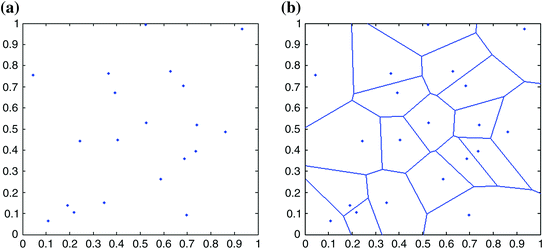
Simple example of Voronoi diagram is shown in Fig. ] which is famous in computer graphic applications.
Fig. 1.3
Generated b Voronoi diagram for a randomly distributed seed point
1.3 Expression of Weldment
As already mentioned in introduction section, grain boundary observed in metals microstructure has morphological similarity to typical Voronoi diagram. Nucleus of single metal crystal and grain boundary can be matched to seed point and Voronoi edge consecutively. Therefore if the position of seed point can be controlled according to solidification process parameter, Voronoi diagram can be used as microstructure, exactly speaking, grain boundary, prediction tool. Inspired by the morphological similarity and possibility of predicting grain boundary structure, the author gave an idea to develop Voronoi diagram as microstructure prediction tool then tested its feasibility by reproducing microstructure of weldment. The reason of selection of weldment for feasibility test target is that welding process shows various microstructure types in small domain. It has locally molten and re-solidified zone. Therefore it shows recrystallized zones with and without melting at the same time. And the weldment undergoes comparatively rapid cooling rate. So, it is a good example which contains coarse and fine grain boundary structures and anisotropically shaped crystals altogether in common domain.
Before practical Voronoi diagram simulation, formation of weldment microstructure should be understood first. Typical heat sources for welding are arc and laser, and a region directly exposed to heat source will be molten and re-solidified. This section is referred as fusion zone (FZ) and it undergoes comparatively rapid cooling rate because cumulated heat is quickly conducted to surrounding solid part. Of course its microstructure is changed by re-crystallization and therefore it has different grain boundary structure from base metal. If its temperature is high enough, metal can be re-crystallized in solid state without melting. A region surrounding FZ and receiving heat from it is also undergoes re-crystallization by this way. This re-crystallized solid region is called as heat affected zone (HAZ). Therefore weldment is categorized into three types, FZ, HAZ and base metal (BM). For most cases, HAZ shows coarsened grain boundary because it continuously receives heat from FZ therefore has relatively slow cooling rate which gives enough growth time to grains. Interesting feature of FZ is columnar crystal. It shows slab-sided shape because of directional growth of grain. When the nucleation is started at the liquid/solid boundary, grains can competitively grow only in cooling direction towards liquid side. Then it is resulted as epitaxial columnar crystals. And the crystals longitudinal direction is, of course, perpendicular to liquid/solid boundary which is corresponding to FZ/HAZ boundary in this research.
