• Complain

Chris Conlan - Automated Trading with R: Quantitative Research and Platform Development

Here you can read online Chris Conlan - Automated Trading with R: Quantitative Research and Platform Development full text of the book (entire story) in english for free. Download pdf and epub, get meaning, cover and reviews about this ebook. publisher: Apress, Berkeley, CA, genre: Home and family. Description of the work, (preface) as well as reviews are available. Best literature library LitArk.com created for fans of good reading and offers a wide selection of genres:

Romance novel Science fiction Adventure Detective Science History Home and family Prose Art Politics Computer Non-fiction Religion Business Children Humor

Choose a favorite category and find really read worthwhile books. Enjoy immersion in the world of imagination, feel the emotions of the characters or learn something new for yourself, make an fascinating discovery.

Chris Conlan Automated Trading with R: Quantitative Research and Platform Development
  • Book:
    Automated Trading with R: Quantitative Research and Platform Development
  • Author:
  • Publisher:
    Apress, Berkeley, CA
  • Genre:
  • Rating:
    5 / 5
  • Favourites:
    Add to favourites
  • Your mark:
    • 100
    • 1
    • 2
    • 3
    • 4
    • 5

Automated Trading with R: Quantitative Research and Platform Development: summary, description and annotation

We offer to read an annotation, description, summary or preface (depends on what the author of the book "Automated Trading with R: Quantitative Research and Platform Development" wrote himself). If you haven't found the necessary information about the book — write in the comments, we will try to find it.

Chris Conlan: author's other books


Who wrote Automated Trading with R: Quantitative Research and Platform Development? Find out the surname, the name of the author of the book and a list of all author's works by series.

Automated Trading with R: Quantitative Research and Platform Development — read online for free the complete book (whole text) full work

Below is the text of the book, divided by pages. System saving the place of the last page read, allows you to conveniently read the book "Automated Trading with R: Quantitative Research and Platform Development" online for free, without having to search again every time where you left off. Put a bookmark, and you can go to the page where you finished reading at any time.

Light

Font size:

Reset

Interval:

Bookmark:

Make
Part 1
Problem Scope
Chris Conlan 2016
Chris Conlan Automated Trading with R 10.1007/978-1-4842-2178-5_1
1. Fundamentals of Automated Trading
Chris Conlan 1
(1)
Bethesda, Maryland, USA
Electronic supplementary material
The online version of this chapter (doi: 10.1007/978-1-4842-2178-5_1 ) contains supplementary material, which is available to authorized users.
The fundamental goal of trading is to maximize risk-adjusted return. When developing strategies, we will simulate trading performance in an attempt to maximize risk-adjusted return in simulation. There are many ways to measure risk-adjusted return. They involve examining the shape of the equity curve and the return series .
Equity Curve and Return Series
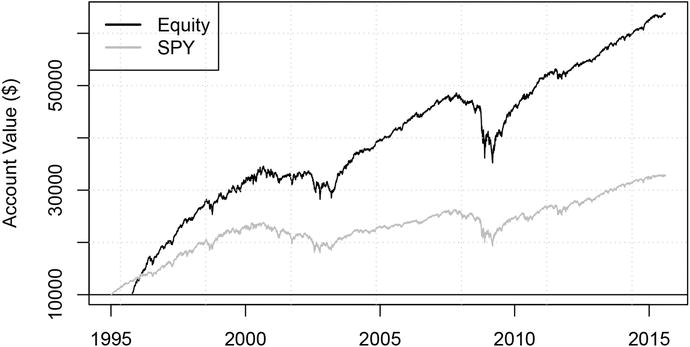
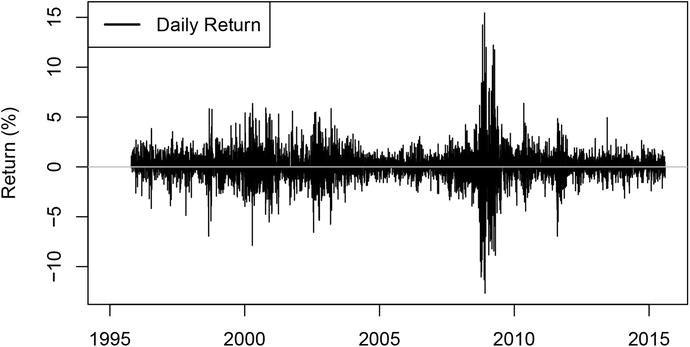
The equity curve is the trading account value plotted against time. It can otherwise be thought of as cash on hand plus the equity value of portfolio assets plotted against time. We want it to rise linearly if we trade with a uniform account size or exponentially if we reinvest gains. The return series is the list of returns on the account at each trading period. The return series depends only on which assets are traded when, not the trading account size, so it will be the same whether or not we reinvest gains.
Figure shows an example of an equity curve generated by a strategy that is long up to ten S&P 500 stocks at a time with a trading account of $10,000, trading once per day, without reinvesting gains. A gray reference line is plotted for an equivalent investment in the SPY S&P 500 ETF, a tradable fund that closely mimics the behavior of the S&P 500.
Figure 1-1 Example equity curve The return series is the portfolio gain or - photo 1
Figure 1-1.
Example equity curve
The return series is the portfolio gain or loss as a percentage of tradable capital at each trading period. Figure .
Figure 1-2 Example return series Characteristics of the Equity Curve We - photo 2
Figure 1-2.
Example return series
Characteristics of the Equity Curve
We will introduce some notation to study characteristics of the equity curve .
We define Picture 3 to be the dollar value of the portfolio before adjustment and Picture 4 to be the dollar value of the portfolio after adjustment for t in 0, 1, 2,..., T , where t= 0 represents the beginning of simulation and t=T represents the current time.
We assume that portfolio adjustments (or trades) happen instantaneously in time. The change in P from t 0 to t 1 represents change due to adjustment, while the change in P from ( t 1)1 to t 0 represents change due to movement of market prices of the assets in the portfolio. Chronologically, t evolves as with transitions from t 0 to t 1 happening instantaneously when an algorithm - photo 5 , with transitions from t 0 to t 1 happening instantaneously when an algorithm automatically adjusts the portfolio.
We define C 0 as initial cash, Picture 6 and as uninvested cash at t 0 and t 1 and K t as trading costs incurred during - photo 7 as uninvested cash at t 0 and t 1, and K t as trading costs incurred during instantaneous adjustment from t 0 to t 1. The equity curve at time t 0 is equal to the following:
Note that for t 0 Further we note that the difference between and - photo 8
Note that Picture 9 for t =0. Further, we note that the difference between Automated Trading with R Quantitative Research and Platform Development - image 10 and Automated Trading with R Quantitative Research and Platform Development - image 11 is the total of trading costs incurred during the adjustment period, from t 0 to t 1.
Automated Trading with R Quantitative Research and Platform Development - image 12
When we plot the equity curve and perform risk-return computations on it, we use only Picture 13 for t in 0, 1,..., T . The choice of Picture 14 over Picture 15 is intended to reflect the impact of commissions in the equity curve.
Characteristics of the Return Series
We define V t to be the tradable capital at time t 0. This is a value set by the trader. The total cash invested by the trader cannot exceed V t at any given time. We define t ( i 1) and t ( i 0) to be the times t 1 and t 0 at which trade i was initiated and exited, respectively. Trade i is considered to be active at time t if Automated Trading with R Quantitative Research and Platform Development - image 16 . We say that Picture 17 if i is active at t 1. We define j i as the asset initiated in trade i . Further, allow Picture 18 and Picture 19 to be subsettable by asset such that Picture 20 represents the value of asset j in the portfolio at time t 1.
If we make 15 trades in the instantaneous adjustment period occurring from t 0 to t 1, there will be 15 new i s subsettable to t for these transactions. This allows us to make infinitely many overlapping trades and describe them using our notation.
The tradable capital must meet the following condition for all t in 0, 1,..., T :
Automated Trading with R Quantitative Research and Platform Development - image 21
where V t is determined during or prior to ( t 1) based on information available at that time.
Verbally, this means the sum of the initial purchase prices of all active trades is less than or equal to the tradable capital. Note that there is no restriction regarding the relationship between V t and Picture 22 or Picture 23 . This is because Picture 24 and Picture 25
Next page
Light

Font size:

Reset

Interval:

Bookmark:

Make

Similar books «Automated Trading with R: Quantitative Research and Platform Development»

Look at similar books to Automated Trading with R: Quantitative Research and Platform Development. We have selected literature similar in name and meaning in the hope of providing readers with more options to find new, interesting, not yet read works.


Reviews about «Automated Trading with R: Quantitative Research and Platform Development»

Discussion, reviews of the book Automated Trading with R: Quantitative Research and Platform Development and just readers' own opinions. Leave your comments, write what you think about the work, its meaning or the main characters. Specify what exactly you liked and what you didn't like, and why you think so.