Introduction
Cytochemistry is the discipline that is applied to visualize specific molecules in individual cells and has become an essential tool in life sciences. Most users of cytochemical techniques do not realize nowadays that they are performing cytochemistry when they are labeling specific cellular proteins for flow cytometry and cell sorting, because this has become routine. Flow cytometry and cell sorting are undoubtedly the most frequently-used applications of cytochemistry these days. Besides, cytochemistry has been an essential tool in electron microscopical analysis of specific molecules in cells to understand functioning of subcellular compartments. Here, electron dense markers have to be used instead of fluorescence markers. Recently, nanoscopy has become available for light and fluorescence microscopy at the nanoscale using approaches such as STED, SIM, PALM, and STORM []. These techniques do not obey the law of Abbe with respect to the limit of spatial resolution when using light to obtain images because of the wavelength character of light. For nanoscopy, cytochemistry is essential to visualize intracellular molecular processes. The ultimate goal in the coming years will be nanoscopy of living cells so that intracellular molecular dynamics can be studied. Text books will then be rewritten in a similar way as in the past decades on the basis of living cell imaging in the micrometer range using cytochemistry and confocal microscopy.
Cytochemistry as it is applied these days is almost exclusively based on immunocytochemistry to visualize specific proteins. It should be realized that the presence of a protein in (sub)cellular compartments does not automatically mean that this protein exerts the activity the researcher thinks that he/she investigates. It becomes more and more clear that epigenetic and posttranslational modifications of a protein, its microenvironment and/or its moonlighting (i.e., exerting different functions) are essential aspects of cellular proteins. Therefore, tools to visualize activity of proteins in situ are urgently needed to increase our understanding of cellular functions in health and disease. One such cytochemical approach is the visualization of the activity of a specific type of protein, enzymes, using enzyme cytochemistry or metabolic mapping. In fact, it is the oldest cytochemical approach of single molecule cytochemistry since Gomori published his cytochemical study on phosphatase activity in 1939 [].
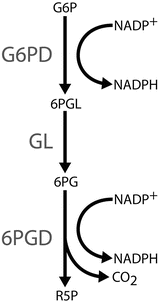
In this chapter, we present the cytochemical visualization of glucose-6-phosphate dehydrogenase (G6PD) deficiency, the most prevalent enzyme deficiency worldwide, to illustrate recent developments in enzyme cytochemistry or metabolic mapping. G6PD is the key enzyme in the oxidative pentose phosphate pathway (PPP). This pathway is one of the major pathways in which nicotinamide adenine dinucleotide phosphate (NADP+) is converted into its reduced form NADPH, which is essential for the protection against reactive oxygen species (ROS) in cells and in particular erythrocytes (Fig. ].
Fig. 1
The NADPH-producing steps of the oxidative pentose phosphate pathway. 6PG 6-phosphogluconate, 6PGD 6-phosphogluconate dehydrogenase, 6PGL 6-phosphogluconolactone, G6P glucose-6-phosphate, G6PD glucose-6-phosphate dehydrogenase, GL gluconolactonase, R5P ribulose-5-phosphate
Early History of G6PD Deficiency
Accounts of G6PD deficiency can be traced back to Pythagoras . The ancient Greek philosopher and mathematician reportedly forbade his followers to eat fava beans ( Vica faba ), possibly because of their potential to induce favism [].
Enzymology
G6PD is the rate-limiting enzyme of the PPP. The enzyme is a monomer of 515 amino acids and has a molecular mass of over 59 kDa [].
The severity of G6PD deficiency is usually measured in four classes in which class I is the most severe form of deficiency and class IV has near to normal function (Table ]. Mutations in the region of the enzyme where NADP+ or G6P bind cause severe loss of G6PD activity and are associated with class I deficiencies. These deficiencies are rare but can induce transfusion dependency as patients in this class usually suffer from chronic non-spherocytic hemolytic anemia . The other classes of deficiency are usually asymptomatic unless patients are in contact with agents that induce hemolytic stress.
Table 1
Classes of G6PD deficiency
WHO class | Severity | Percentage of normal G6PD function, % |
|---|
Class I | Severe mutations with chronic non-spherocytic hemolytic anemia | |
Class II | Intermediate | |
Class III | Mild | 1060 |
Class IV |

