it-ebooks - Technical Indicators and Overlays
Here you can read online it-ebooks - Technical Indicators and Overlays full text of the book (entire story) in english for free. Download pdf and epub, get meaning, cover and reviews about this ebook. year: 2018, publisher: iBooker it-ebooks, genre: Home and family. Description of the work, (preface) as well as reviews are available. Best literature library LitArk.com created for fans of good reading and offers a wide selection of genres:
Romance novel
Science fiction
Adventure
Detective
Science
History
Home and family
Prose
Art
Politics
Computer
Non-fiction
Religion
Business
Children
Humor
Choose a favorite category and find really read worthwhile books. Enjoy immersion in the world of imagination, feel the emotions of the characters or learn something new for yourself, make an fascinating discovery.

- Book:Technical Indicators and Overlays
- Author:
- Publisher:iBooker it-ebooks
- Genre:
- Year:2018
- Rating:5 / 5
- Favourites:Add to favourites
- Your mark:
- 100
- 1
- 2
- 3
- 4
- 5
Technical Indicators and Overlays: summary, description and annotation
We offer to read an annotation, description, summary or preface (depends on what the author of the book "Technical Indicators and Overlays" wrote himself). If you haven't found the necessary information about the book — write in the comments, we will try to find it.
Technical Indicators and Overlays — read online for free the complete book (whole text) full work
Below is the text of the book, divided by pages. System saving the place of the last page read, allows you to conveniently read the book "Technical Indicators and Overlays" online for free, without having to search again every time where you left off. Put a bookmark, and you can go to the page where you finished reading at any time.
Font size:
Interval:
Bookmark:
From: http://stockcharts.com/school/doku.php?id=chart_school:technical_indicators
This article is designed to introduce the concept of technical indicators and explain how to use them in your analysis. We will shed light on the difference between leading and lagging indicators, as well as look into the benefits and drawbacks. Many, if not most, popular indicators are shown as oscillators. With this in mind, we will also show how to read oscillators and explain how signals are derived. Later we will turn our focus to specific technical indicators and provide examples of signals in action.
A technical indicator is a series of data points that are derived by applying a formula to the price data of a security. Price data includes any combination of the open, high, low or close over a period of time. Some indicators may use only the closing prices, while others incorporate and open interest into their formulas. The price data is entered into the formula and a data point is produced.
For example, the average of 3 closing prices is one data point [ (41+43+43) / 3 = 42.33 ]. However, one data point does not offer much information and does not an indicator make. A series of data points over a period of time is required to create valid reference points to enable analysis. By creating a time series of data points, a comparison can be made between present and past levels. For analysis purposes, technical indicators are usually shown in a graphical form above or below a security's price chart. Once shown in graphical form, an indicator can then be compared with the corresponding price chart of the security. Sometimes indicators are plotted on top of the price plot for a more direct comparison.
A technical indicator offers a different perspective from which to analyze the price action. Some, such as , have complex formulas and require more study to fully understand and appreciate. Regardless of the complexity of the formula, technical indicators can provide a unique perspective on the strength and direction of the underlying price action.
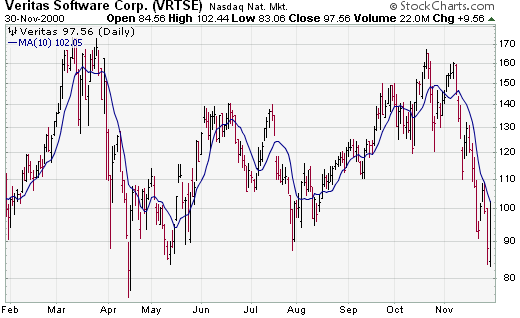
A simple moving average is an indicator that calculates the average price of a security over a specified number of periods. If a security is exceptionally volatile, then a moving average will help to smooth the data. A moving average filters out random noise and offers a smoother perspective of the price action. Veritas (VRTSE) displays a lot of volatility and an analyst may have difficulty discerning a trend. By applying a 10-day simple moving average to the price action, random fluctuations are smoothed to make it easier to identify a trend.
Indicators serve three broad functions: to alert, to confirm and to predict.
- An indicator can act as an alert to study price action a little more closely. If momentum is waning, it may be a signal to watch for a break of support. Or, if there is a large positive divergence building, it may serve as an alert to watch for a resistance breakout.
- Indicators can be used to confirm other technical analysis tools. If there is a breakout on the price chart, a corresponding moving average crossover could serve to confirm the breakout. Or, if a stock breaks support, a corresponding low in the (OBV) could serve to confirm the weakness.
- Some investors and traders use indicators to predict the direction of future prices.
Indicators indicate. This may sound straightforward, but sometimes traders ignore the price action of a security and focus solely on an indicator. Indicators filter price action with formulas. As such, they are derivatives and not direct reflections of the price action. This should be taken into consideration when applying analysis. Any analysis of an indicator should be taken with the price action in mind. What is the indicator saying about the price action of a security? Is the price action getting stronger? Weaker?
Even though it may be obvious when indicators generate signals, the signals should be taken in context with other technical analysis tools. An indicator may flash a buy signal, but if the chart pattern shows a descending triangle with a series of declining peaks, it may be a false signal.
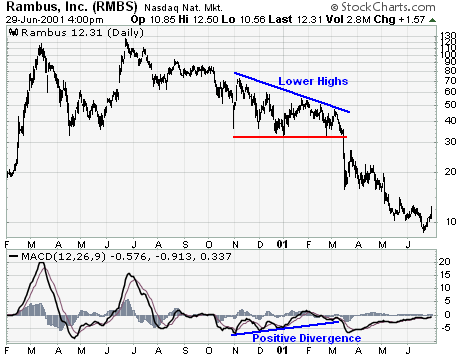
On the Rambus (RMBS) chart, improved from November to March, forming a positive divergence. All the earmarks of a MACD buying opportunity were present, but the stock failed to break above the resistance and exceed its previous reaction high. This non-confirmation from the stock should have served as a warning sign against a long position. For the record, a sell signal occurred when the stock broke support from the descending triangle in March-01.
As always in technical analysis, learning how to read indicators is more of an art than a science. The same indicator may exhibit different behavioral patterns when applied to different stocks. Indicators that work well for IBM might not work the same for Delta Airlines. Through careful study and analysis, expertise with the various indicators will develop over time. As this expertise develops, certain nuances, as well as favorite setups, will become clear.
There are hundreds of indicators in use today, with new indicators being created every week. Technical analysis software programs come with dozens of indicators built in and even allow users to create their own. Given the amount of hype that is associated with indicators, choosing an indicator to follow can be a daunting task. Even with the introduction of hundreds of new indicators, only a select few really offer a different perspective and are worthy of attention. Strangely enough, the indicators that usually merit the most attention are those that have been around the longest time and have stood the test of time.
When choosing an indicator to use for analysis, choose carefully and moderately. Attempts to cover more than five indicators are usually futile. It is best to focus on two or three indicators and learn their intricacies inside and out. Try to choose indicators that complement each other, instead of those that move in unison and generate the same signals. For example, it would be redundant to use two indicators that are good for showing levels, such as Stochastics and RSI. Both of these indicators measure momentum and both have overbought/oversold levels.
As their name implies, leading indicators are designed to lead price movements. Most represent a form of price .
Many leading indicators come in the form of momentum oscillators. Generally speaking, momentum measures the rate-of-change of a security's price. As the price of a security rises, price momentum increases. The faster the security rises (the greater the period-over-period price change), the larger the increase in momentum. Once this rise begins to slow, momentum will also slow. As a security begins to trade flat, momentum starts to actually decline from previous high levels. However, declining momentum in the face of sideways trading is not always a bearish signal. It simply means that momentum is returning to a more median level.
Font size:
Interval:
Bookmark:
Similar books «Technical Indicators and Overlays»
Look at similar books to Technical Indicators and Overlays. We have selected literature similar in name and meaning in the hope of providing readers with more options to find new, interesting, not yet read works.
Discussion, reviews of the book Technical Indicators and Overlays and just readers' own opinions. Leave your comments, write what you think about the work, its meaning or the main characters. Specify what exactly you liked and what you didn't like, and why you think so.


