• Complain

Kate Strachnyi - ColorWise: A Data Storytellers Guide to the Intentional Use of Color

Here you can read online Kate Strachnyi - ColorWise: A Data Storytellers Guide to the Intentional Use of Color full text of the book (entire story) in english for free. Download pdf and epub, get meaning, cover and reviews about this ebook. year: 2022, publisher: OReilly Media, genre: Home and family. Description of the work, (preface) as well as reviews are available. Best literature library LitArk.com created for fans of good reading and offers a wide selection of genres:

Romance novel Science fiction Adventure Detective Science History Home and family Prose Art Politics Computer Non-fiction Religion Business Children Humor

Choose a favorite category and find really read worthwhile books. Enjoy immersion in the world of imagination, feel the emotions of the characters or learn something new for yourself, make an fascinating discovery.

Kate Strachnyi ColorWise: A Data Storytellers Guide to the Intentional Use of Color
  • Book:
    ColorWise: A Data Storytellers Guide to the Intentional Use of Color
  • Author:
  • Publisher:
    OReilly Media
  • Genre:
  • Year:
    2022
  • Rating:
    3 / 5
  • Favourites:
    Add to favourites
  • Your mark:
    • 60
    • 1
    • 2
    • 3
    • 4
    • 5

ColorWise: A Data Storytellers Guide to the Intentional Use of Color: summary, description and annotation

We offer to read an annotation, description, summary or preface (depends on what the author of the book "ColorWise: A Data Storytellers Guide to the Intentional Use of Color" wrote himself). If you haven't found the necessary information about the book — write in the comments, we will try to find it.

Data has become the most powerful tool in business today, and telling its story effectively is critical. Yet one of the best communicatorscoloris the most neglected tool in data visualization. With this book, DATAcated founder Kate Strachnyi provides the ultimate guide to the correct use of color for representing data in graphs, charts, tables, and infographics.

Ideal for data and business analysts, data scientists, and others who design infographics and data visualizations, this practical resource explores color tips and tricks, including the theories behind them and why they work the way they do. ColorWise covers the psychology, history, and culture of many different colors. This book is also a useful teaching tool for learning about proper use of color for data storytelling techniques and dashboarding.

Youll explore:

  • The role that color theory plays in data visualization and storytelling
  • Various color techniques you can use to improve data visualizations
  • How colors affect your audiences understanding of data visualizations
  • How to use color intentionally to help guide your audience
  • Tips for using colors that people with color vision deficiency can interpret
  • How to apply the books guidelines for use in your own projects

Kate Strachnyi: author's other books


Who wrote ColorWise: A Data Storytellers Guide to the Intentional Use of Color? Find out the surname, the name of the author of the book and a list of all author's works by series.

ColorWise: A Data Storytellers Guide to the Intentional Use of Color — read online for free the complete book (whole text) full work

Below is the text of the book, divided by pages. System saving the place of the last page read, allows you to conveniently read the book "ColorWise: A Data Storytellers Guide to the Intentional Use of Color" online for free, without having to search again every time where you left off. Put a bookmark, and you can go to the page where you finished reading at any time.

Light

Font size:

Reset

Interval:

Bookmark:

Make
ColorWise by Kate Strachnyi Copyright 2023 DATAcated Inc All rights reserved - photo 1
ColorWise

by Kate Strachnyi

Copyright 2023 DATAcated Inc. All rights reserved.

Printed in the United States of America.

Published by OReilly Media, Inc. , 1005 Gravenstein Highway North, Sebastopol, CA 95472.

OReilly books may be purchased for educational, business, or sales promotional use. Online editions are also available for most titles (http://oreilly.com). For more information, contact our corporate/institutional sales department: 800-998-9938 or corporate@oreilly.com.

  • Editors: Angela Rufino and Michelle Smith
  • Production Editor: Kate Galloway
  • Interior Designer: Monica Kamsvaag
  • Cover Designer: Susan Thompson
  • Illustrator: Kate Dullea
  • November 2022: First Edition
Revision History for the Early Release
  • 2022-05-06: First Release
  • 2022-10-04: Second Release
  • 2022-10-25: Third Release

See http://oreilly.com/catalog/errata.csp?isbn=9781492097846 for release details.

The OReilly logo is a registered trademark of OReilly Media, Inc. ColorWise, the cover image, and related trade dress are trademarks of OReilly Media, Inc.

The views expressed in this work are those of the author and do not represent the publishers views. While the publisher and the author have used good faith efforts to ensure that the information and instructions contained in this work are accurate, the publisher and the author disclaim all responsibility for errors or omissions, including without limitation responsibility for damages resulting from the use of or reliance on this work. Use of the information and instructions contained in this work is at your own risk. If any code samples or other technology this work contains or describes is subject to open source licenses or the intellectual property rights of others, it is your responsibility to ensure that your use thereof complies with such licenses and/or rights.

978-1-492-09778-5

Preface
A Note for Early Release Readers

With Early Release ebooks, you get books in their earliest formthe authors raw and unedited content as they writeso you can take advantage of these technologies long before the official release of these titles.

If you have comments about how we might improve the content and/or examples in this book, or if you notice missing material within this chapter, please reach out to the author at .

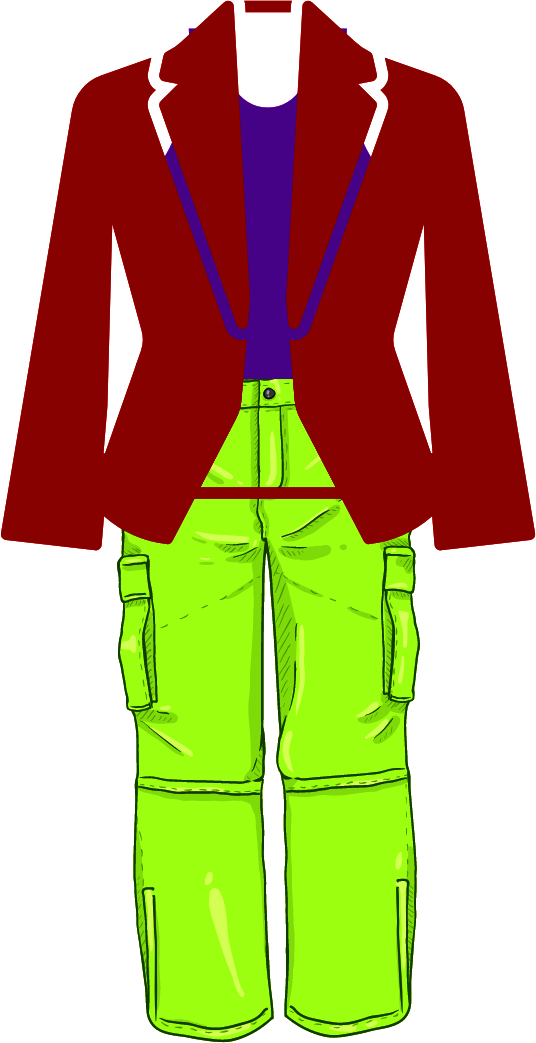
Its the day of the big interview for the job youve been after all your life. You wake up extra early, eat a healthy, energizing breakfast, take a 30-minute jog to get all your synapses firing, and take a hot shower to feel fully ready to conquer the world. Youve got your clothes all laid out to impress the interview team with your sense of style and professionalism and head out the door in your bright red jacket, lime green pants, and neon purple shirt. Look out world, here you come ()!

Figure P-1 Mismatched outfit with a mix of colors Cringeworthy right Unless - photo 2
Figure P-1. Mismatched outfit with a mix of colors

Cringeworthy, right? Unless the position you are interviewing for is a clown at the circus, those colors are not going to do the job today or any other day. We are extraordinarily cautious with colors we choose to wear, the colors we paint our homes with, the colors we choose for our cars, even the colors we select for our oh-so-important smartphone cases!

Yet when it comes time to select colors for our infographics and data visualization creations, we often act like someone shook up a rainbow and spilled it all over the floor. Color is by far the most abused and neglected tool in data visualization. We abuse it by making color choices that make no sense and we neglect it when we populate our hard work with software default settings selected years ago in a computer lab somewhere.

The lack of focus and commitment to color is a perplexing thing. When used correctly, color has no equal as a visualization toolin advertising, in branding, in getting the message across to any audience you seek. Data analysts can make numbers dance and sing on command, but they sometimes struggle to create visually stimulating environments that convince the intended audience to tap their feet in time. Sales and marketing experts understand the customers mindset, but often cannot seem to help from turning simple charts and graphs into a kaleidoscope of shades and hues that require a roadmap to figure out which side is up.

Fortunately, in the preceding example, we dont have to design our own fashions, although we do need to be responsible for being the best infographic tailors we can be in order to get color combinations that fit our purposes, engage our intended audiences, and draw the eye to the exact spot we want it to in order to deliver the intended message every time.

Why I Wrote This Book

As founder of DATAcated, I see a staggering and frustrating amount of data visualizations where color is being poorly used on a weekly basis. Dozens of years ago when color was still a luxury on paper reports, and most businesses were still living in a black-and-white environment, misusing color wasnt the death knell that it is today. But with every business worth its salt the world over now fully embracing the digital revolution, real-time collaboration, and all of the bells and whistles that go with these advances, knowing how to use color appropriately has evolved from a nicety to a necessity.

We learn about color from an early age, but understanding how it connects our eyes to our brains and how the proper usage can transform graphics is an elusive subject for many. Thats why I decided to undertake this book. To go on a mission to educate business and data professionals on the proper use of color.

The power of the internet and digital technology has clogged every industry and every niche with a glut of businesses all pursuing the same finite number of customers. That means companies need to scrape and claw for the type of differentiation that will elevate them away from the competition and crystalize why their offering is the best one on the market, whether thats for end-use customers, in business-to-business (B2B) relationships, or to promote our own projects inside the company environment.

How This Book Is Organized

This is a book that can be read in two ways. You can take it from beginning to end, creating a base of knowledge that starts at the broadest of foundations and builds upon that knowledge to define and refine very specific concepts of color as they relate to data visualization. Or, if you have experience in the field already, you can use this book as a reference guide that can greatly augment your existing skills when it comes to utilizing color correctly to represent data in graphs, charts, tables, and infographics. In doing so, you can learn more about not only the individual tips and tricks, but the theory behind them, why they work the way they do, and how to take the basics and augment them for your own future projects.

Regardless of which route you decide to takeand feel free to try boththis book will educate you on:

  • The history, biology, and psychology of color theory

  • Definitions of data visualization and data storytelling and colors vital role in both

  • A myriad of rules and suggestions on how to select the best color scheme for your next data visualization

  • How to appropriately address color vision deficiency to avoid alienating those without the full range of visual capabilities

Next page
Light

Font size:

Reset

Interval:

Bookmark:

Make

Similar books «ColorWise: A Data Storytellers Guide to the Intentional Use of Color»

Look at similar books to ColorWise: A Data Storytellers Guide to the Intentional Use of Color. We have selected literature similar in name and meaning in the hope of providing readers with more options to find new, interesting, not yet read works.


Reviews about «ColorWise: A Data Storytellers Guide to the Intentional Use of Color»

Discussion, reviews of the book ColorWise: A Data Storytellers Guide to the Intentional Use of Color and just readers' own opinions. Leave your comments, write what you think about the work, its meaning or the main characters. Specify what exactly you liked and what you didn't like, and why you think so.