• Complain

Nivedita Majumdar - MATLAB Graphics and Data Visualization Cookbook

Here you can read online Nivedita Majumdar - MATLAB Graphics and Data Visualization Cookbook full text of the book (entire story) in english for free. Download pdf and epub, get meaning, cover and reviews about this ebook. year: 2012, publisher: Packt Publishing, genre: Home and family. Description of the work, (preface) as well as reviews are available. Best literature library LitArk.com created for fans of good reading and offers a wide selection of genres:

Romance novel Science fiction Adventure Detective Science History Home and family Prose Art Politics Computer Non-fiction Religion Business Children Humor

Choose a favorite category and find really read worthwhile books. Enjoy immersion in the world of imagination, feel the emotions of the characters or learn something new for yourself, make an fascinating discovery.

Nivedita Majumdar MATLAB Graphics and Data Visualization Cookbook

MATLAB Graphics and Data Visualization Cookbook: summary, description and annotation

We offer to read an annotation, description, summary or preface (depends on what the author of the book "MATLAB Graphics and Data Visualization Cookbook" wrote himself). If you haven't found the necessary information about the book — write in the comments, we will try to find it.

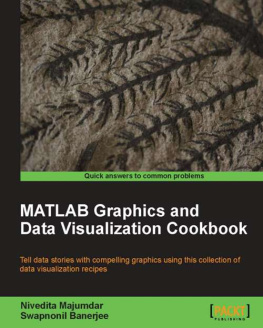
Tell data stories with compelling graphics using this collection of data visualization recipes

Overview

  • Collection of data visualization recipes with functionalized versions of common tasks for easy integration into your data analysis workflow
  • Recipes cross-referenced with MATLAB product pages and MATLAB Central File Exchange resources for improved coverage
  • Includes hand created indices to find exactly what you need; such as application driven, or functionality driven solutions

In Detail

MATLABs customizable graphics elements allow you to tailor your visualizations for exactly what you need to present; alter the figure and axis properties, lighting, transparency and camera position. Use MATLAB to apply volume visualizations to your data as well as interactivity and animation, or to plot your data in 1, 2, 3 and higher data dimensions.

MATLAB Graphics and Data Visualization Cookbook will serve as your handbook to help you know the right graphic to showcase your data and teach you how to create it in clear step-by-step instructions.

Tasks range from simple graphs using built-in MATLAB commands, to complex functions making frequently used customizations easy to implement.

Learn about the key customizable elements in MATLAB graphics starting from figure and axis property settings, color, lighting, transparency and camera positioning to strategies for more advanced data visualization including adding interactivity and animation. Finish with recipes on presentation and publication.

Learn the techniques and easily customize the recipes to apply to your datasets.

What you will learn from this book

  • Jump start your first MATLAB plot
  • Strengthen your knowledge of standard graph types and learn new advanced types
  • Common visualization mistakes that people make and how to avoid them
  • Easily adapt recipes from the book to best display your data - one, two, three dimensions, and beyond
  • Say more with legends, annotations, labels, different layouts, and color
  • Design superior data displays with custom lighting, transparency, and camera positioning
  • Do animations and interactive graphics with MATLAB
  • Fix the resolution and format before employing the Publish command

Approach

MATLAB Graphics and Data Visualization Cookbook will serve as your handbook in recipe format with ample screenshots. Each independent recipe will help you in achieving target-oriented solutions to your problems with concise explanation.

Who this book is written for

For those who are already using MATLAB for their computational needs but need to also harness its powerful visualization capabilities.

Nivedita Majumdar: author's other books


Who wrote MATLAB Graphics and Data Visualization Cookbook? Find out the surname, the name of the author of the book and a list of all author's works by series.

MATLAB Graphics and Data Visualization Cookbook — read online for free the complete book (whole text) full work

Below is the text of the book, divided by pages. System saving the place of the last page read, allows you to conveniently read the book "MATLAB Graphics and Data Visualization Cookbook" online for free, without having to search again every time where you left off. Put a bookmark, and you can go to the page where you finished reading at any time.

Light

Font size:

Reset

Interval:

Bookmark:

Make
MATLAB Graphics and Data Visualization Cookbook

MATLAB Graphics and Data Visualization Cookbook

Copyright 2012 Packt Publishing

All rights reserved. No part of this book may be reproduced, stored in a retrieval system, or transmitted in any form or by any means, without the prior written permission of the publisher, except in the case of brief quotations embedded in critical articles or reviews.

Every effort has been made in the preparation of this book to ensure the accuracy of the information presented. However, the information contained in this book is sold without warranty, either express or implied. Neither the authors, nor Packt Publishing, and its dealers and distributors will be held liable for any damages caused or alleged to be caused directly or indirectly by this book.

Packt Publishing has endeavored to provide trademark information about all of the companies and products mentioned in this book by the appropriate use of capitals. However, Packt Publishing cannot guarantee the accuracy of this information.

First published: November 2012

Production Reference: 1191112

Published by Packt Publishing Ltd.

Livery Place

35 Livery Street

Birmingham B3 2PB, UK.

ISBN 978-1-84969-316-5

www.packtpub.com

Cover Image by Asher Wishkerman (<>)

Credits

Authors

Nivedita Majumdar

Swapnonil Banerjee

Reviewers

Dr. John Bemis

Adee Ran

Ashish Uthama

David Woo

Acquisition Editor

Joanna Finchen

Lead Technical Editor

Kedar Bhat

Technical Editors

Dipesh Panchal

Copy Editor

Alfida Paiva

Project Coordinator

Yashodhan Dere

Proofreader

Stephen Swaney

Indexer

Rekha Nair

Graphics

Valentina D'silva

Production Coordinator

Arvindkumar Gupta

Cover Work

Arvindkumar Gupta

About the Authors

Nivedita Majumdar is a software development engineer with extensive experience with MATLAB. She has a PhD in Computational Sciences and Informatics. She has been developing data analysis tools and algorithms for the communications and life sciences industries for the past decade. She is deeply interested in visualization as a tool for insightful data exploration. She is an enthusiastic proponent of MATLAB as the preferred environment for data visualization and algorithm prototyping.

Swapnonil Banerjee is a theoretical physicist with a PhD in Physics and a Bachelors degree in Electronics and Telecommunications Engineering. He has extensive MATLAB development experience in the areas of signal processing, numerical data modeling, curve fitting, differential calculus, and Monte Carlo simulations.

Acknowledgement

We gratefully acknowledge the support of several individuals and organizations in developing this book.

We would like to begin with a special thanks to David Woo for being constantly encouraging and providing valuable, actionable ideas for the book.

We are grateful to our family and friends for their love and the pride they take in our work. It has been very nice to have the enthusiasm of Shuman Majumdar on our behalf.

We would like to thank our reviewers John Bemis, Adee Ran, Ashish Uthama, and David Woo for patiently providing detailed critique of our work and great suggestions for improvement.

Importantly, we would like to thank Yashodhan Dere, Kedar Bhat, Dipesh Panchal, Joanna Finchen, and the rest of the team at Packt for being supportive throughout this project.

We would like to thank MathWorksTM for their book program that made software licenses available to us. We are grateful for their well maintained MATLAB Central File Exchange program that showcases the work of so many in the MATLAB community whose contributions we were able to build upon.

We would like to thank the University of California, Irvine and Stanford University for maintaining great public use data repositories that we were able to leverage.

Finally, we would like to thank Daniel B Carr, professor at George Mason University, who introduced us to the subject of data visualization.

About the Reviewers

Dr. John Bemis is a senior manager at Baker Hughes, Inc. John holds a BA degree in Chemistry from Grinnell College and a PhD in Inorganic Chemistry from the University of Wisconsin. John has 16 years of professional software development experience starting at TecMag Inc., designing and implementing user interfaces for magnetic resonance instrument data acquisition and control. He has spent the last 12 years at Baker Hughes, Inc., first developing MATLAB based data analysis software for magnetic resonance applications, and most recently as manager of the software technical project engineers for the Drilling and Evaluation Technology division.

Adee Ran received a BS degree in Electrical Engineering in 1991 and an MS degree in Electrical Engineering in 2000, both from the Israel Institute of Technology (Technion). He is a physical-layer communication systems architect at Intel's Israel Design Center in Haifa, Israel. He is also an active member of the IEEE 802.3 Ethernet Working Group and a devoted user and programmer of MATLAB ever since the days of Version 3.5.

Ashish Uthama is a developer in the Image Processing Toolbox team at MathWorks, makers of MATLAB. He has a Bachelor's degree in Electronics and Communication from PESIT, Bangalore, India and a Master's degree in Applied Science from UBC, Vancouver, Canada.

David Woo manages a team of algorithm developers in the Genetic Analysis R&D division at Life Technologies where data analysis and visualization are an important part of everyday work. He has a Master's degree in Electrical Engineering and 12 years of experience developing biotechnology instrumentation including DNA sequencers and real-time PCR thermal cyclers. He holds several patents in this area. In particular, he and his team focus on the data transformation from the time series images of biochemical reactions that produce fluorescence to biologically meaningful DNA base calls and gene quantification. Bridging the gap between engineering and biology is challenging, but ultimately rewarding, as the results improve health care and push the understanding of molecular biology. DNA sequencing has grown immensely since the completion of the first human genome, and genetic testing is rapidly becoming an indispensible tool to doctors, but as the volume of data increases, so does the need for data analysis and visualization.

www.PacktPub.com
Support files, eBooks, discount offers and more

You might want to visit www.PacktPub.com for support files and downloads related to your book.

Did you know that Packt offers eBook versions of every book published, with PDF and ePub files available? You can upgrade to the eBook version at > for more details.

At www.PacktPub.com, you can also read a collection of free technical articles, sign up for a range of free newsletters and receive exclusive discounts and offers on Packt books and eBooks.

httpPacktLibPacktPubcom Do you need instant solutions to your IT - photo 1

http://PacktLib.PacktPub.com

Do you need instant solutions to your IT questions? PacktLib is Packt's online digital book library. Here, you can access, read and search across Packt's entire library of books.

Next page
Light

Font size:

Reset

Interval:

Bookmark:

Make

Similar books «MATLAB Graphics and Data Visualization Cookbook»

Look at similar books to MATLAB Graphics and Data Visualization Cookbook. We have selected literature similar in name and meaning in the hope of providing readers with more options to find new, interesting, not yet read works.


Reviews about «MATLAB Graphics and Data Visualization Cookbook»

Discussion, reviews of the book MATLAB Graphics and Data Visualization Cookbook and just readers' own opinions. Leave your comments, write what you think about the work, its meaning or the main characters. Specify what exactly you liked and what you didn't like, and why you think so.