DayTrading Forex with Price Patterns
ByLaurentiu Damir
Copyright 2012 Laurentiu Damir
All rights reserved. No part of this bookmay be reproduced or transmitted in any form or by any means, electronic ormechanical, including photocopying, recording, or any information storage andretrieval system, without prior written permission of the Author. Your supportof authors rights is appreciated.
Table of contents
A very clean and extremely profitable day trading systemthat does not use technical indicators of any kind, but only concentrates onreading the price action. It focuses first on the bigger picture to find outwhich of the buyers and sellers are more powerful at any given time and thenuses this information for day trading on smaller timeframes with the help ofvery strong patterns that price makes. This is all you need; this is all thissystem needs in order to deliver a thousand pips per month or more. Beginner tradersoften think that for achieving success in the foreign exchange market, theyhave to invent something, to be unique, to come up with some complicatedtrading techniques that no one else has thought of before. This is very wrong.Forex is not about uniqueness at all, it is about a very large group of peoplebuying or selling at the same time. The more people that buy or sell at a givenlevel of price, the greater are the chances of success. If you develop a uniquestrategy and then start to buy or sell according to it, the levels of pricewhere you buy/sell will be overlooked by the majority of traders out there,they will not do the same thing you did because they dont know your uniquesystem, and they dont base trading decisions on it. In conclusion, you alwayshave to go with the crowd not against it; the more obvious and well knownthings are by the people out there, the greater the chances of success. This isin part what makes this trading system very profitable, it works with veryclear, very popular and easily identifiable price patterns. Being very popular,most traders watch them closely and trade them when they finally break. Anotherimportant part that makes this system profitable is trade managementtechniques, knowing how to set and trail manually your stop loss levels inorder to obtain the maximum from every trade. All of this being said, let us godeeper into the components of this trading system.
Before we start looking for price patterns and learn howto best trade them, we need first to look at the bigger picture and establishthe direction of out potential trades. We do not just trade in any direction assoon as a pattern emerges on a small time frame, we go first to a highertimeframe to see who is in control at that time, the buyer or the seller. We dothis by going to the 4 hours chart zoomed out to the maximum and finding themost recent big impulsive move. You probably already know that in the forexmarket or any other financial market the price of a pair or stock does not gostraight-up or down. Instead, price moves in waves that consist of strongimpulsive moves in one direction followed by corrective smaller moves in theopposite direction. These waves put together form a trend. Let us see anexample of impulsive and corrective moves:
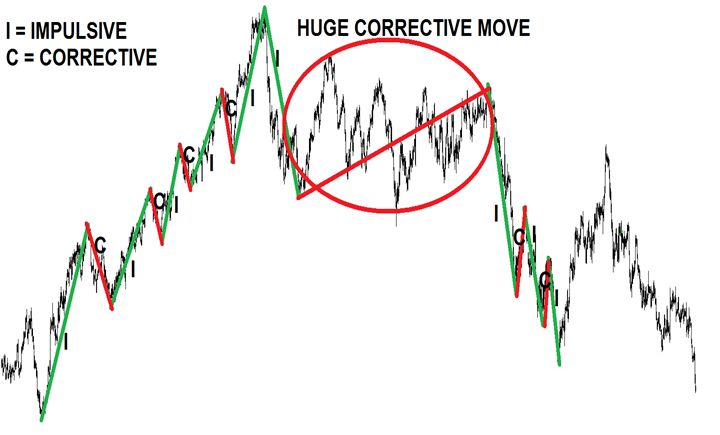
In the above example starting from left to right, we havefirst an uptrend. Price makes a strong impulsive move followed by a smallcorrection move then again a strong impulsive move upwards and again acorrective small move. This repeats four times. If we have strong impulsivemoves upwards it means that the direction we are looking for is clearly up asthe trend is obviously up. Every time we look at the 4 hours chart and we seethat the most recent impulsive move is up like in the chart above, we know thatour potential trades will only be in the direction of that impulsive move,meaning we will only look to buy. The logic behind this is very simple. If themost recent big move is up, that means buyers are stronger than the sellers atthis moment, so it is very likely that after a small correction move where theytake some profits out of the market, the buyers will start to pick up the paceagain and drive the price further up with another big move. That is indeed whathappened in the chart above and it happened 4 times in a row. After this, atthe very top you can see that instead of a correction small move price made ahuge move down surpassing the start of the last impulsive move up. This makesthis move down an impulsive move as well, it is now the most recent big move; ithas gone below the start of the last move up. This means the direction of pricehas changed, we will at this point only look to sell if a price pattern occurson smaller timeframe. We then have a very wide correction move where price justmoves in a range, but as long as it does not go up over the start of thatimpulsive move down it is a correction move and the direction is still down. Afterthe correction finally completes, we have another three impulsive moves downwith the first two of them followed by small corrections. This clearly tells usthat direction/trend is down and we will only be looking to sell. With thisdirection in mind we then go to the smaller timeframe chart and wait for apattern to form. If the pattern is broken on the upside, we do not trade it asour direction is down and we only look to sell at this moment. As I saidbefore, the direction or trend on the bigger timeframe shows us who is incontrol, which of the buyers and sellers have more power and conviction todrive the price to new levels. If the direction is up, that means that the buyersare in control, they have won the war with the sellers, they are the majorityand they will drive the price up. We go with them, with the majority because itis much easier to trade profitable this way. Remember what I said in thebeginning, the more people that do the same thing you do, the more chances ofsuccess. We do not trade against the majority. The same thing applies to thesellers as well. Let us see another example of how to spot the last impulsivemove:
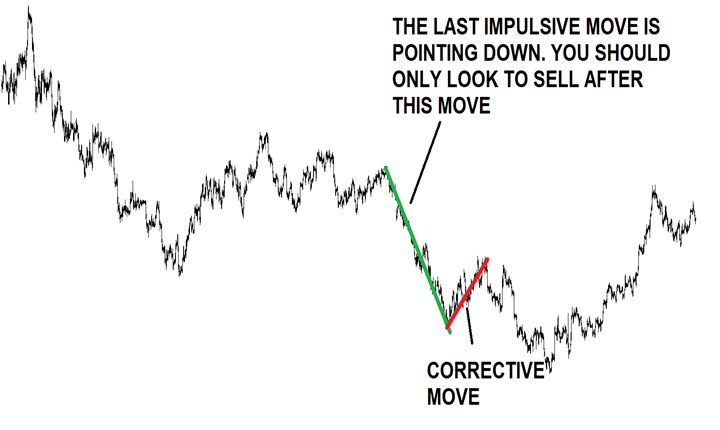
Things are clear, we have a big move down, this is themost recent big move, and the sellers are in control so we will only be lookingto sell. Another example:
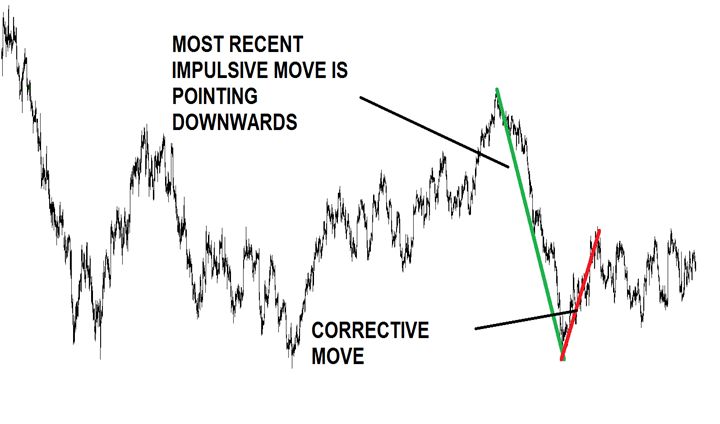
This is very clear as well. We only look to sell.
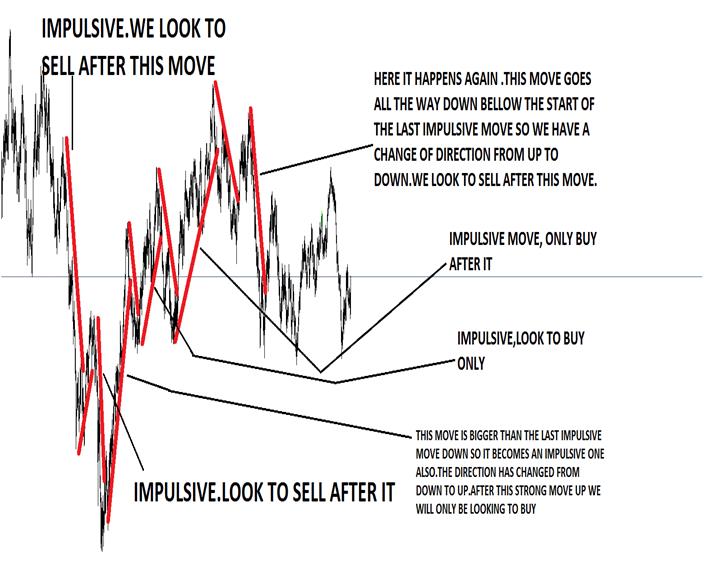
Here we have first two impulsive moves down after whichwe only look to sell, the third big move goes all the way up above the start ofthe previous move so it is not a correction, it becomes an impulsive move aswell. We look to buy as the direction has changed. After this, we have another twoimpulsive moves up followed by another change in direction from up to down whenthat last impulsive move down goes bellow the start point of the previous. Thisis simple to do, just go to any chart and you will see that you can easilyidentify the last big move. Okay, now that we know how to identify thedirection of our future potential trades let us turn our attention to the pricepatterns.
They are formations that happen all the time in yourcharts and they give us very important clues about what is going on between thebuyers and the sellers. There are two major categories of patterns:continuation and reversal patterns. The reversal patterns signal that a trendchange is about to happen while the continuation patterns suggest that themarket is only pausing for a little while before the current trend resumes. Asthis is a trend following day trading system, we will only use the continuationprice patterns. The most popular and reliable continuation patterns are thefollowing: flag pattern, pennant pattern, rectangle pattern, symmetricaltriangle, ascending triangle, descending triangle patterns, cup with handlepattern, the price channel pattern and the wedge pattern.
Next page

