Laurentiu Damir - Day Trading Forex with S&R Zones - Forex Trading System
Here you can read online Laurentiu Damir - Day Trading Forex with S&R Zones - Forex Trading System full text of the book (entire story) in english for free. Download pdf and epub, get meaning, cover and reviews about this ebook. year: 2012, genre: Romance novel. Description of the work, (preface) as well as reviews are available. Best literature library LitArk.com created for fans of good reading and offers a wide selection of genres:
Romance novel
Science fiction
Adventure
Detective
Science
History
Home and family
Prose
Art
Politics
Computer
Non-fiction
Religion
Business
Children
Humor
Choose a favorite category and find really read worthwhile books. Enjoy immersion in the world of imagination, feel the emotions of the characters or learn something new for yourself, make an fascinating discovery.

- Book:Day Trading Forex with S&R Zones - Forex Trading System
- Author:
- Genre:
- Year:2012
- Rating:5 / 5
- Favourites:Add to favourites
- Your mark:
Day Trading Forex with S&R Zones - Forex Trading System: summary, description and annotation
We offer to read an annotation, description, summary or preface (depends on what the author of the book "Day Trading Forex with S&R Zones - Forex Trading System" wrote himself). If you haven't found the necessary information about the book — write in the comments, we will try to find it.
- Forex Price Action Day Trading System to make 1000 pips per month with
- Low Risk - High Reward Trading (1:3 Risk-Reward ratio)
- Clear entry, stop loss and exit levels
- Timeframes used: 1hour and 4hour
- Moving averages
- Support and resistance levels
- Price patterns
- Trendlines
Laurentiu Damir: author's other books
Who wrote Day Trading Forex with S&R Zones - Forex Trading System? Find out the surname, the name of the author of the book and a list of all author's works by series.


Day Trading Forex with S&R Zones - Forex Trading System — read online for free the complete book (whole text) full work
Below is the text of the book, divided by pages. System saving the place of the last page read, allows you to conveniently read the book "Day Trading Forex with S&R Zones - Forex Trading System" online for free, without having to search again every time where you left off. Put a bookmark, and you can go to the page where you finished reading at any time.
Font size:
Interval:
Bookmark:
DayTrading Forex with S&R Zones
ByLaurentiu Damir
Copyright 2012 Laurentiu Damir
All rights reserved. No part of this bookmay be reproduced or transmitted in any form or by any means, electronic ormechanical, including photocopying, recording, or any information storage andretrieval system, without prior written permission of the Author. Your supportof authors rights is appreciated.
Tableof Contents
Day trading the foreign exchange market can be veryprofitable if you know what you are doing, if you have a set of rules to followand if you have the discipline and patience to respect them. Let me show youwhat this day trading system can do if applied to the forex market:
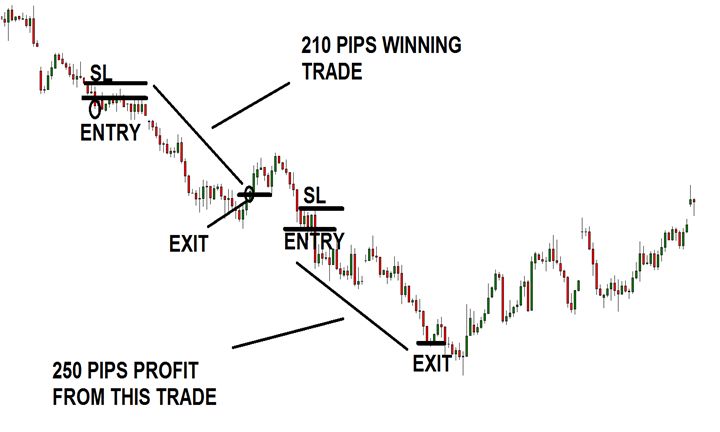
You can see in the diagram above two trades taken usingthis system. All the trades with this forex strategy look exactly the same.They have small stop loss levels and a high reward. The first sell order in theexample above won 210 pips, the second sell order made 250 pips.
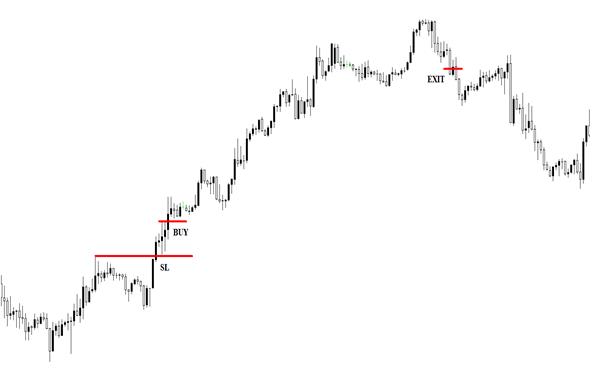
Here is another trade example with this strategy. Verysmall stop loss, 215 pips profit. I will now go through every component of thistrading strategy, explain them in detail and at the end, put them together togive you the complete forex trading system.
This system uses the 200 period exponential movingaverage or 200EMA. You have to insert this moving average on your chartsbecause it will tell you if you have to look for trade setups to buy or lookfor trade setups to sell. This is the most popular moving average in thetrading markets; many people watch it and use it as a direction indicator. Thisstrategy uses this moving average in the following way: when the price of anyforex pair is completely above the moving average we start looking for tradesetups to only buy the pair. When the pair is trading completely below thismoving average, we will be looking for trade setups only to sell that pair. Letme show you more clearly what this means:
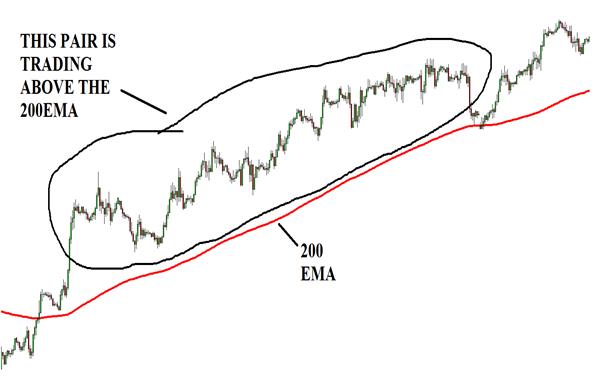
As you can see in the diagram above, price action forthis pair is completely above the exponential moving average, it never touchesit. This is good; it means that you can start to look for trade setups. We willdo that later. If the price does touch the 200EMA but quickly bounces back uplike it did in the chart above at the end there, that is also a good thing. Nowlet me show you when not to look for trade setups even if the price is above orbelow the moving average:

Here you can see that price is above the moving averagefor the most part but it intersects with it there in the middle of the chartand does not bounce back up quickly enough. The pair trades there in the zoneof the EMA, passing it multiple times, returning to the upside, and thencrossing it again to the downside. This is not good; it means that the uptrendin this case, is not strong enough so you will not be looking for trade setupsif you see this kind of price action behavior. You always have to look for theprice action to be completely above or below the moving average or just touchingit for a brief period and then bounce off of it and resume its direction. Thereis one more important thing about the moving average that you always have tokeep an eye on. The slope of the moving average has to be always in thedirection of the price action. In the two charts above you can see that thedirection of the price action is clearly to the upside and so is the slope ofthe moving average, its pointing up. On the last chart, in that middle sectionthat we discussed you can see that the moving average has no slope there, it issideways. That is a good indication to stay out of the market. Let me give youan example:

When you see this on one of your charts, you have to govisit some other pair to look for trade setups. The moving average is almosthorizontal, and the price action is ranging, its going up and down crossingthe EMA.
We will be using the 4 hours timeframe to see the overalltrend as explained earlier. If the pair trades above the 200 period exponentialmoving average then the trend is up, if it trades below the moving average thenthe trend is down. After we do this, we go to the 1 hour chart and do the samething. If on the 4h chart price is above the EMA, on the 1 hour chart pricemust also be above the moving average for us to consider looking for tradesetups on that pair. Same goes for the other direction, if on the 4h chart thepair is trading below the EMA, on the 1h chart price must also be trading belowthe 200EMA and the EMA itself must be sloping down on both timeframes. Onlywhen these conditions are met we will watch that pair for potential trades andonly in the direction of the trend shown to us by the 200EMA. If a pair istrading above the moving average on the 4h and 1h charts and the EMA is slopingup on both charts then we will be looking for trade setups to buy that pair. Ifa pair is trading below the moving average on both 4h and 1h charts and the EMAis sloping down on both timeframes we will be looking to sell that pair if atrade setup occurs.
You might ask yourself why do you need to look at thesame moving average on two different timeframes. Well, the answer is -confirmation. If on the 4h chart, the pair trades above the EMA this tells usthat the overall trend of that pair is up. When you go to the 1h chart and seethat the same thing is happening there too, then you have a confirmation ofwhat you saw on the 4h chart and you also know that the overall trend isgaining strength and momentum because the short term trend on the 1h chart isin line with the bigger trend. These are the perfect conditions for you totrade and maximize your profits. When these conditions present themselves on achart then you will be using the same 1h chart zoomed out to find the mostsignificant support or resistance area. After identifying these areas, you willstay on the same 1h chart but zoomed in this time to wait for a trade setup tooccur and then carry the trade from entry to exit. We will discuss how to dothis later.
You may ask yourself why to trade on the 1h chart and notthe 5 or 15 minutes chart. Day trading is not about entering trades on thesmallest timeframe possible. The smaller the timeframe the less accurate yourtrading setups will be and the more losing trades you will have. For a tradesetup to be a winner it must hold significance within the overall picture. Asupport or resistance level on the zoomed out 1h chart has far greaterimportance than one on a smaller timeframe, therefore it has much greaterchances of success.
As I said earlier, we will be looking for significantsupport or resistance levels on the zoomed out 1h chart. Here is a chart toshow you what to look for:

In the above 1h chart, you can see that there is adowntrend, price is below the 200EMA, and the moving average is sloping down.The same is true for the 4h chart on that pair at that moment in time. You cansee three points in the market where buyers have stepped up to push the priceup only for the seller to step in again and resume the downtrend surpassingthese levels. Those three levels are support zones.
Next pageFont size:
Interval:
Bookmark:
Similar books «Day Trading Forex with S&R Zones - Forex Trading System»
Look at similar books to Day Trading Forex with S&R Zones - Forex Trading System. We have selected literature similar in name and meaning in the hope of providing readers with more options to find new, interesting, not yet read works.
Discussion, reviews of the book Day Trading Forex with S&R Zones - Forex Trading System and just readers' own opinions. Leave your comments, write what you think about the work, its meaning or the main characters. Specify what exactly you liked and what you didn't like, and why you think so.