• Complain

Tom Hathaway - Data Flow Diagramming by Example: Process Modeling Techniques for Requirements Elicitation

Here you can read online Tom Hathaway - Data Flow Diagramming by Example: Process Modeling Techniques for Requirements Elicitation full text of the book (entire story) in english for free. Download pdf and epub, get meaning, cover and reviews about this ebook. year: 2015, publisher: BA-EXPERTS, genre: Home and family. Description of the work, (preface) as well as reviews are available. Best literature library LitArk.com created for fans of good reading and offers a wide selection of genres:

Romance novel Science fiction Adventure Detective Science History Home and family Prose Art Politics Computer Non-fiction Religion Business Children Humor

Choose a favorite category and find really read worthwhile books. Enjoy immersion in the world of imagination, feel the emotions of the characters or learn something new for yourself, make an fascinating discovery.

Tom Hathaway Data Flow Diagramming by Example: Process Modeling Techniques for Requirements Elicitation
  • Book:
    Data Flow Diagramming by Example: Process Modeling Techniques for Requirements Elicitation
  • Author:
  • Publisher:
    BA-EXPERTS
  • Genre:
  • Year:
    2015
  • Rating:
    3 / 5
  • Favourites:
    Add to favourites
  • Your mark:
    • 60
    • 1
    • 2
    • 3
    • 4
    • 5

Data Flow Diagramming by Example: Process Modeling Techniques for Requirements Elicitation: summary, description and annotation

We offer to read an annotation, description, summary or preface (depends on what the author of the book "Data Flow Diagramming by Example: Process Modeling Techniques for Requirements Elicitation" wrote himself). If you haven't found the necessary information about the book — write in the comments, we will try to find it.

A Data Flow Diagram (DFD) is a phenomenal tool for visualizing and analyzing dependencies and interactions amongst manual and automated business processes. In todays wired world, software applications often take center stage in optimizing workflow and increasing productivity. Unfortunately, the process of delivering the right software to the right people at the right time is challenging to say the least. DFDs are powerful tools for recognizing and eliminating two of the major problems that haunt IT projects, namely Scope Creep and Project Overruns caused by late project change requests.
This eBook explains what a DFD is, why you need one, and how to create it. You will learn the benefits of process visualization for the business community, for the one wearing the BA hat, for those tasked with developing the solution, and ultimately for the entire organization.

Tom Hathaway: author's other books


Who wrote Data Flow Diagramming by Example: Process Modeling Techniques for Requirements Elicitation? Find out the surname, the name of the author of the book and a list of all author's works by series.

Data Flow Diagramming by Example: Process Modeling Techniques for Requirements Elicitation — read online for free the complete book (whole text) full work

Below is the text of the book, divided by pages. System saving the place of the last page read, allows you to conveniently read the book "Data Flow Diagramming by Example: Process Modeling Techniques for Requirements Elicitation" online for free, without having to search again every time where you left off. Put a bookmark, and you can go to the page where you finished reading at any time.

Light

Font size:

Reset

Interval:

Bookmark:

Make
Data Flow Diagramming
by Example
Process Modeling Techniques
for Requirements Elicitation

Thomas Hathaway
Angela Hathaway

2015 by BA-Experts.

All rights reserved. No part of this publication may be reproduced, stored in a retrieval system, or transmitted in any form or by any means, electronic, mechanical, photocopying, recording, or otherwise without prior permission of the copyright holder.

The contents of this publication are provided in good faith and neither The Authors nor The Publisher can be held responsible for any errors or omissions contained herein. Any person relying upon the information must independently satisfy himself or herself as to the safety or any other implications of acting upon such information and no liability shall be accepted either by The Author or The Publisher in the event of reliance upon such information nor for any damage or injury arising from any interpretation of its contents. This publication may not be used in any process of risk assessment.

Preface

This eBook was neither created For Dummies nor For Complete Idiots, but for normal people in the real world to give them a basic understanding of business analysis concepts and techniques. Many people do business analysis although it is not in their job description. Whether you are the CEO, COO, Director, Manager, or on the front lines, you may be involved in defining how technology can benefit you and your organization. When you are in that awesome role, you are at that time the one wearing the Business Analysis (BA) hat.

In todays wired world, software applications often take center stage in optimizing workflow and increasing productivity. Unfortunately, the process of delivering the right software to the right people at the right time is challenging to say the least. This eBook presents Data Flow Diagrams (DFDs) as a phenomenal tool for visualizing and analyzing dependencies and interactions amongst manual and automated business processes. It explains what a DFD is, why you need one, and how to create it. You will learn the benefits of process visualization for the business community, for the one wearing the BA hat, for those tasked with developing the solution, and ultimately for the entire organization. You will also discover how DFDs are powerful tools for recognizing and eliminating two of the major problems that haunt IT projects, namely Scope Creep and Project Overruns caused by late project change requests.

About the Authors

Angela and Tom Hathaway have authored and delivered hundreds of training courses and publications to thousands of business analysts around the world. They have facilitated numerous requirements discovery sessions for information technology projects under a variety of acronyms (JAD, ASAP, JADr, JRP, etc.).

Based on their personal journey and experiences reported by their students, they recognized how much anyone can benefit from a basic understanding of what a Data Flow Diagram is, what they represent, who needs one, and how to get started creating one.

Angelas and Toms mission is to allow anyone, anywhere access to simple, easy-to-learn techniques by sharing their experience and expertise in their training seminars, blog posts, eBooks, video courses, KnowledgeKnuggets, and public presentations.

Additional Resources

The contents of this eBook are also contained in our instructor-led training which we offer online or at your site. Peruse our training program.

Table of Contents
Introduction to Data Flow Diagrams (DFDs) for the Business
Questions answered in this chapter What is a Data Flow Diagram DFD When do - photo 1
Questions answered in this chapter:
  • What is a Data Flow Diagram (DFD)?
  • When do I need one?
Business Processes, Data Flows, and Value Chains

A picture really is worth a thousand words, especially in the world of Business Analysis for IT projects. Try to describe workflows or business processes in natural language and the chances that IT will deliver the solution you want are very small indeed. The challenge is what picture do you need to draw?

There are several techniques for drawing process models or diagrams at various levels of detail and each has a specific focus. Data Flow Diagrams (DFDs) represent the workflow or steps within a process with a focus on the flow and transformation of data. You can create DFDs at the business level (as in this example) representing business processes and business data or at the system level depicting IT applications, databases, and files. Since we are talking about business analysis, our focus will be creating and using data flow diagrams at the business level.

Every business process is a more-or-less complex sequence of steps that changes - photo 2

Every business process is a more-or-less complex sequence of steps that changes something coming in to create something new. As such, the process needs some form of input, which could be information or any other resource. By definition, a data flow diagram is a picture of how the depicted processes create, consume, transport, and store data. A DFD is the right choice for business process modeling if you need to understand the creation and use of data within the individual business processes. Those processes can be manual or automated; it does not matter as far as the diagram is concerned.

Processes use input to create output whether the output is something - photo 3

Processes use input to create output, whether the output is something altogether new or simply an altered version of the original input. Since the process adds some measurable value to the input, we often refer to the value chain of the organization.

Fundamentally, any diagram is simply a picture with constraints. In the case of the DFD, the constraints are which symbols you can use and what each symbol means. There are really only two widely used conventions for drawing DFDs and the differences are minimal. Both allow only four basic symbols.

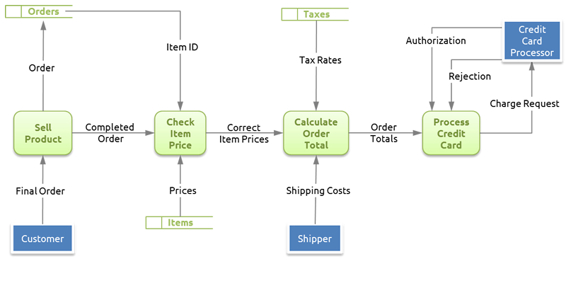
A rounded rectangle (or a circle depending on which convention you follow) represents a process at some level of detail. The name of the process tells us what the process does (i.e., what its primary function is) in common business terms. Since functions are actions, the name consists of an active verb (what is done) and a direct object (what is it done to e.g., PROCESS CREDIT CARD, SELL PRODUCT, CHECK ITEM PRICE).

As you can see from the examples the named process can be at any level of - photo 4

As you can see from the examples, the named process can be at any level of detail, from the very high-level (SELL PRODUCT) to the very low-level (CHECK ITEM PRICE).

Processes Interact with Data

An arrow represents a data flow, meaning information coming from somewhere and going somewhere else. Because the data is moving from somewhere to somewhere, the arrow points in the direction of movement. Every data flow has to have a name. Because it represents data and data is a thing, the name has to be a noun with or without appropriate modifiers (i.e., Credit Card Authorization, Invoice, Item Number). As with the process, the named data flow can be at any level of detail.

A data store is simply data at rest It is not going anywhere so it cannot be a - photo 5

Next page
Light

Font size:

Reset

Interval:

Bookmark:

Make

Similar books «Data Flow Diagramming by Example: Process Modeling Techniques for Requirements Elicitation»

Look at similar books to Data Flow Diagramming by Example: Process Modeling Techniques for Requirements Elicitation. We have selected literature similar in name and meaning in the hope of providing readers with more options to find new, interesting, not yet read works.


Reviews about «Data Flow Diagramming by Example: Process Modeling Techniques for Requirements Elicitation»

Discussion, reviews of the book Data Flow Diagramming by Example: Process Modeling Techniques for Requirements Elicitation and just readers' own opinions. Leave your comments, write what you think about the work, its meaning or the main characters. Specify what exactly you liked and what you didn't like, and why you think so.