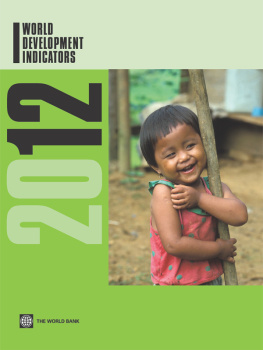
2012| WORLD DEVELOPMENT
INDICATORS
Copyright 2012 by the International Bank
for Reconstruction and Development/THE WORLD BANK
1818 H Street NW, Washington, D.C. 20433 USA
All rights reserved
Manufactured in the United States of America
First printing April 2012
This volume is a product of the staff of the Development Data Group of the World Banks Development Economics Vice Presidency, and the judgments herein do not necessarily reflect the views of the World Banks Board of Executive Directors or the countries they represent.
The World Bank does not guarantee the accuracy of the data included in this publication and accepts no responsibility whatsoever for any consequence of their use. The boundaries, colors, denominations, and other information shown on any map in this volume do not imply on the part of the World Bank any judgment on the legal status of any territory or the endorsement or acceptance of such boundaries. This publication uses the Robinson projection for maps, which represents both area and shape reasonably well for most of the earths surface. Nevertheless, some distortions of area, shape, distance, and direction remain.
The material in this publication is copyrighted. Requests for permission to reproduce portions of it should be sent to the Office of the Publisher at the address in the copyright notice above. The World Bank encourages dissemination of its work and will normally give permission promptly and, when reproduction is for noncommercial purposes, without asking a fee. Permission to photocopy portions for classroom use is granted through the Copyright Center, Inc., Suite 910, 222 Rosewood Drive, Danvers, MA 01923 USA.
Photo credits: World Bank photo library, except page 282, David Cieslikowski/World Bank.
If you have questions or comments about this product, please contact:
Development Data Group
The World Bank
1818 H Street NW, Room MC2-812, Washington, D.C. 20433 USA
Hotline: 800 590 1906 or 202 473 7824; fax 202 522 1498
Email:
Web site: www.worldbank.org or data.worldbank.org
ISBN 978-0-8213-8985-0
ECO-AUDIT
Environmental Benefits Statement
The World Bank is committed to preserving endangered forests and natural resources. The Office of the Publisher has chosen to print World Development Indicators 2012 on recycled paper with 50 percent postconsumer fiber in accordance with the recommended standards for paper usage set by the Green Press Initiative, a nonprofit program supporting publishers in using fiber that is not sourced from endangered forests. For more information, visit www.greenpressinitiative.org.
Saved:
64 trees
26 million Btu of total energy
6,503 pounds of net greenhouse gases
29,321 gallons of waste water
1,859 pounds of solid waste

2012| WORLD DEVELOPMENT
INDICATORS

PREFACE
World Development Indicators 2012 is a compilation of relevant, high-quality, and internationally comparable statistics about development and the quality of peoples lives. Organized around six themesworld view, people, the environment, the economy, states and markets, and global linksit aims to put data into the hands of policy makers, development specialists, students, and the public. We encourage and applaud the use of the data presented here to help reduce poverty and to solve the worlds most pressing development challenges.
The full dataset used to produce World Development Indicators contains more than 1,000 indicators for 216 economies, with many time series extending back to 1960. Highly visual, interactive, and multilingual presentations of the data are available at the popular website http://data.worldbank.org and through the DataFinder application for mobile devices. And, as a major part of the World Banks Open Data Initiative, the data are freely available for use and reuse under an open license. A companion printed volume, TheLittle Data Book 2012, presents a selection of indicators for each economy, and the biennial Statistics for Small States presents data for less-populated developing countries.
This 16th edition of World Development Indicators relies heavily on statistics produced by national authorities and agencies. Since the first edition in 1997, there has been a substantial increase in the availability and quality of the data, thanks to improvements in statistical capacity in many countries. More remains to be done: the capacity to use statistical data remains weak; demand is growing for greater disaggregation of indicators (for instance by sex, age, or geography); and data in some key areas, such as agriculture, are often missing or outdated. A new global statistical action plan (www.paris21.org/busan-action-plan), endorsed in November 2011 at the highest political levels at the Fourth High Level Forum on Aid Effectiveness in Busan, Republic of Korea, provides an important framework to address remaining challenges, to integrate statistics into decision making, to promote open access to data and improve their use, and to increase resources for statistical systems.
World Development Indicators is possible only through the excellent collaboration of many partners who provide the data for this collection, and I would like to thank them all: the United Nations family, the International Monetary Fund, the International Telecommunication Union, the Organisation for Economic Co-operation and Development, the statistical offices of more than 200 economies, and countless others whose support and advice have made this unique product possible.
As always, we welcome your ideas for making the data in World Development Indicators useful and relevant for improving the lives of people around the world.
Shaida Badiee
Director
Development Economics Data Group
ACKNOWLEDGMENTS
This book was prepared by a team led by Soong Sup Lee under the management of Neil Fantom and comprising Awatif Abuzeid, Azita Amjadi, Maja Bresslauer, David Cieslikowski, Liu Cui, Mahyar Eshragh-Tabary, Shota Hatakeyama, Masako Hiraga, Wendy Ven-dee Huang, Bala Bhaskar Naidu Kalimili, Buyant Khaltarkhuu, Elysee Kiti, Alison Kwong, Ibrahim Levent, Hiroko Maeda, Johan Mistiaen, Maurice Nsabimana, Sulekha Patel, Beatriz Prieto-Oramas, William Prince, Premi Rathan Raj, Evis Rucaj, Emi Suzuki, Eric Swanson, Jomo Tariku, and Estela Zamora, working closely with other teams in the Development Economics Vice Presidencys Development Data Group. World Development Indicators electronic products were prepared by a team led by Reza Farivari and comprising Ramvel Chandrasekaran, Ying Chi, Jean-Pierre Djomalieu, Ramgopal Erabelly, Federico Escaler, Shelley Fu, Gytis Kanchas, Ugendran Makhachkala, Vilas Mandlekar, Nacer Megherbi, Shanmugam Natarajan, Parastoo Oloumi, Atsushi Shimo, Maryna Taran, Malarvizhi Veerappan, and Vera Wen. The work was carried out under the direction of Shaida Badiee. Valuable advice was provided by Zia M. Qureshi and David Rosenblatt.
Next page
