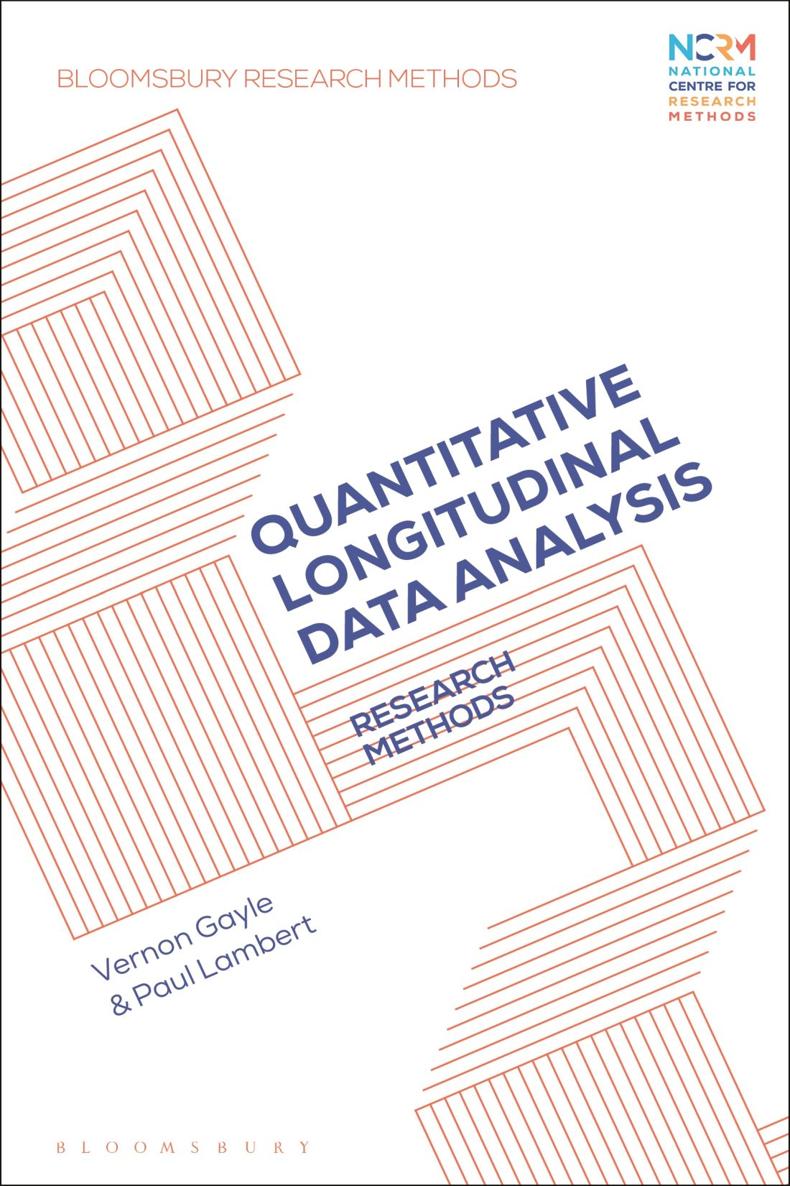
Vernon Gayle - Quantitative Longitudinal Data Analysis
Here you can read online Vernon Gayle - Quantitative Longitudinal Data Analysis full text of the book (entire story) in english for free. Download pdf and epub, get meaning, cover and reviews about this ebook. year: 2020, publisher: Bloomsbury Publishing, genre: Politics. Description of the work, (preface) as well as reviews are available. Best literature library LitArk.com created for fans of good reading and offers a wide selection of genres:
Romance novel
Science fiction
Adventure
Detective
Science
History
Home and family
Prose
Art
Politics
Computer
Non-fiction
Religion
Business
Children
Humor
Choose a favorite category and find really read worthwhile books. Enjoy immersion in the world of imagination, feel the emotions of the characters or learn something new for yourself, make an fascinating discovery.

- Book:Quantitative Longitudinal Data Analysis
- Author:
- Publisher:Bloomsbury Publishing
- Genre:
- Year:2020
- Rating:3 / 5
- Favourites:Add to favourites
- Your mark:
- 60
- 1
- 2
- 3
- 4
- 5
Quantitative Longitudinal Data Analysis: summary, description and annotation
We offer to read an annotation, description, summary or preface (depends on what the author of the book "Quantitative Longitudinal Data Analysis" wrote himself). If you haven't found the necessary information about the book — write in the comments, we will try to find it.
Quantitative Longitudinal Data Analysis — read online for free the complete book (whole text) full work
Below is the text of the book, divided by pages. System saving the place of the last page read, allows you to conveniently read the book "Quantitative Longitudinal Data Analysis" online for free, without having to search again every time where you left off. Put a bookmark, and you can go to the page where you finished reading at any time.
Font size:
Interval:
Bookmark:


Stata output: Regression model (OLS) General Certificate of Secondary Education (GCSE) points score School Year 11 Youth Cohort Study of England and Wales |
Stata output: Regression model (OLS) General Certificate of Secondary Education (GCSE) points score School Year 11 Youth Cohort Study of England and Wales (cohort and gender interactions) |
Selected examples of large-scale cross-nationally harmonized repeated cross-sectional survey projects |
A diagram of a hypothetical study of unemployment |
Stata output: Compact codebook for the college skills program dataset |
Stata output: stdes command for the college skills program data |
Stata output: Kaplan-Meier plot of time to passing the test by teaching methods (college skills program data) |
Stata output: Log-rank test for equality of survivor functions |
Stata output: Cox regression model time to passing the test (college skills program data) |
Stata output: Test of the effects of previous education in Cox regression model of time to passing the test (college skills program data) |
Stata output: Hazard ratios Cox regression model time to passing the test (college skills program data) |
Stata output: Time to passing the test survival functions comparing women aged 30 with 5 previous jobs by teaching methods (college skills program data) |
Snapshot of long format panel dataset |
Snapshot of a collapsed dataset of mean values of variables (in Figure 13 ) |
A summary of the features of the fixed effects panel model |
Graph of a simple set of panel data |
Graph of a simple set of panel data with constant slopes but individual intercepts |
A summary of the features of the random effects panel model |
Simple notation for a pooled cross-sectional model, a fixed effects panel model and a random effects panel model |
Summary of panel dataset measures |
Stata output: Pooled regression model (OLS) |
Stata output: Between effects regression model |
Stata output: Regression model on individual means (manual version of the between effects regression model) |
Stata output: Fixed effects panel model |
Stata output: Random effects panel model |
Stata output: Coefficients (b) and their standard errors (se) from the between effects model, the fixed effects panel model and the random effects panel model |
Stata output: Coefficients F tests for the random effects panel model |
Stata compact codebook for the BHPS extract of male full-time workers aged 2535 waves 110 |
Stata summary for the BHPS extract of male full-time workers aged 2535 waves 110 |
Stata output: Pooled cross-sectional model: usual net pay () per month (adjusted for inflation) male full-time workers aged 2535 waves 110 |
Stata output: Variance inflation factors for the explanatory variables in the pooled cross-sectional model: usual net pay () per month (adjusted for inflation) male full-time workers aged 2535 waves 110 |
Stata output: Pooled cross-sectional models of usual net pay () per month (adjusted for inflation) male full-time workers aged 2535 waves 110 summary of coefficients (b) and their standard errors (se) |
Stata output: xtdes male full-time workers aged 2535 waves 110 |
Stata output: Summary of panel information (xtsum) for usual net pay () per month (adjusted for inflation) male full-time workers aged 2535 waves 110 |
Stata output: Between effects model: usual net pay () per month (adjusted for inflation) male full-time workers aged 2535 waves 110 |
Stata output: Fixed effects panel model: usual net pay () per month (adjusted for inflation) male full-time workers aged 2535 waves 110 |
Stata output: Random effects panel model: usual net pay () per month (adjusted for inflation) male full-time workers aged 2535 waves 110 |
Stata output: Breusch and Pagan Lagrangian multiplier test random effects panel model: usual net pay () per month (adjusted for inflation) male full-time workers aged 2535 waves 110 |
Stata output: Coefficients (b) and their standard errors (se) from the pooled regression model, the between effects model, the fixed effects panel model and the random effects panel model usual net pay () per month (adjusted for inflation) male full-time workers aged 2535 |
Stata output: Compact codebook for the womens employment dataset |
Stata output: Pooled logistic regression model wife employed |
Stata output: Margins (adjusted predictions at means) for the pooled logistic regression model wife employed |
Stata output: Pooled logistic regression model wife employed with robust standard errors |
Stata output: Random effects logit panel model wife employed |
Stata output: Fixed effects logit panel model wife employed |
Stata output: Random effects probit panel model |
Stata output: Margins (adjusted predictions at means) for the random effects probit model wife employed presented in Figure 46 |
An example of variable by case matrix |
An example of a wide format dataset |
An example of a long format dataset |
Sample Stata syntax illustrating the construction of long and wide format datasets using the BHPS (and images of the data formats that are generated) |
Font size:
Interval:
Bookmark:
Similar books «Quantitative Longitudinal Data Analysis»
Look at similar books to Quantitative Longitudinal Data Analysis. We have selected literature similar in name and meaning in the hope of providing readers with more options to find new, interesting, not yet read works.
Discussion, reviews of the book Quantitative Longitudinal Data Analysis and just readers' own opinions. Leave your comments, write what you think about the work, its meaning or the main characters. Specify what exactly you liked and what you didn't like, and why you think so.


