Truth or Truthiness
Teacher tenure is a problem. Teacher tenure is a solution. Fracking is safe. Fracking causes earthquakes. Our kids are overtested. Our kids are not tested enough.
We read claims like these in the newspaper every day, often with no justification other than it feels right. How can we figure out what is right?
Escaping from the clutches of truthiness begins with one simple question: whats the evidence? With his usual verve and flair, Howard Wainer shows how the skeptical mind-set of a data scientist can expose truthiness, nonsense, and outright deception. Using the tools of causal inference he evaluates the evidence, or lack thereof, supporting claims in many fields, with special emphasis in education.
This wise book is a must-read for anyone whos ever wanted to challenge the pronouncements of authority figures and a lucid and captivating narrative that entertains and educates at the same time.
Howard Wainer is a Distinguished Research Scientist at the National Board of Medical Examiners who has published more than four hundred scholarly articles and chapters. This is his twenty-first book. His twentieth book, Medical Illuminations: Using Evidence, Visualization and Statistical Thinking to Improve Healthcare was a finalist for the Royal Society Winton Book Prize.
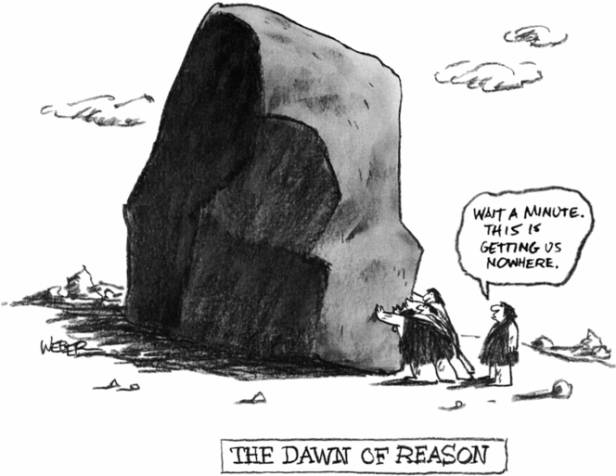
Robert Weber The New Yorker Collection/Cartoon Bank, reproduced with permission.
Truth or Truthiness
Distinguishing Fact from Fiction by Learning to Think Like a Data Scientist
Howard Wainer
National Board of Medical Examiners

32 Avenue of the Americas, New York, NY 10013-2473, USA
Cambridge University Press is part of the University of Cambridge.
It furthers the Universitys mission by disseminating knowledge in the pursuit of education, learning, and research at the highest international levels of excellence.
www.cambridge.org
Information on this title: www.cambridge.org/9781107130579
Howard Wainer 2016
This publication is in copyright. Subject to statutory exception and to the provisions of relevant collective licensing agreements, no reproduction of any part may take place without the written permission of Cambridge University Press.
First published 2016
Printed in the United States of America
A catalog record for this publication is available from the British Library .
ISBN 978-1-107-13057-9 Hardback
Cambridge University Press has no responsibility for the persistence or accuracy of URLs for external or third-party Internet Web sites referred to in this publication and does not guarantee that any content on such Web sites is, or will remain, accurate or appropriate.
To Linda
and
Sam & Jennifer
and
Laurent, Lyn & Koa
Annotated Table of Contents
Exponential growth is something human intuition cannot comprehend. In this chapter we illustrate this with several examples drawn from history and current experience. Then we introduce a simple rule of thumb, often used to help financial planners tame the cognitive load of exponential growth, and show how it can be used more widely to help explain a broad range of other issues. The Rule of 72 illustrates the power of having such rules in your toolbox for use as the need arises.
The frequency of truly extreme observations and the size of the sample of observations being considered are inexorably related. Over the last century the number of musical virtuosos has ballooned to include copious numbers of high school students who can perform pieces that would have daunted all but the most talented artists in the past. In this chapter we find that a simple mathematical model explains this result as well as why a runner breaking the four-minute barrier in the mile has ceased to be newsworthy.
Here we are introduced to Rubins Model for Causal Inference, which directs us to focus on measuring the effect of a cause rather than chasing a chimera by trying to find the cause of an effect. This reorientation leads us naturally to the random assignment-controlled experiment as a key companion to the scientific method. The power of this approach is illustrated by laying out how we can untie the Gordian knot that entangles happiness and performance. It also provides a powerful light that can be used to illuminate the dark corners of baseless claims.
The path toward estimating the size of causal effects does not always run smoothly in the real world because of the ubiquitous nuisance of missing data. In this chapter we examine the very practical situation in which unexpected events occur that unbalance carefully constructed experiments. We use a medical example in which some patients die inconveniently mid-experiment, and we must try to estimate a causal effect despite this disturbance. Once again Rubins Model guides us to a solution, which is unexpectedly both subtle and obvious, once you get used to it.
Public education is a rich field for the application of rigorous methods for the making of causal inferences. Instead, we find that truthiness manifests itself widely within the discussions surrounding public education, the efficacy of which is often measured with tests. Thus it is not surprising that many topics associated with testing arise in which the heat of argument on both sides of the question overwhelms facts. We examine four questions that either have already been decided in courts (but not decisively) or are on the way to court as this chapter was being written.
It is not always practical to perform an experiment, and we must make do with an observational study. Over the past six years the number of serious earthquakes in Oklahoma (magnitude 3.0 or more) has increased from less than two a year to almost two a day. In this chapter we explore how we can use an observational study to estimate the size of the causal effect of fracking and the disposal of wastewater through its high-pressure injection into the earth on seismicity. The evidence for such a connection is overwhelming despite denials from state officials and representatives of the petroleum industry.
A compelling argument can be made that the biggest problem faced by data scientists is what to do about observations that are missing (missing data). In this chapter we learn of what initially seem like completely sensible approaches for dealing with the inevitable missing data, yet they were being exploited to improperly game the system. It also illustrates what may be the most effective way to deal with such shenanigans.
Graphical display is perhaps the most important tool data science possesses that allows the data to communicate their meaning to the data scientist. They are also unsurpassed in thence allowing the scientist to communicate to everyone else as well. By far, the most crucial attitude that anyone wishing to communicate effectively can have is a strong sense of empathy. In this chapter we discuss two different communications and show how the lessons learned from Princeton Universitys acceptance letter could be efficaciously applied in communicating the results of a genetic test for mutations that increase a womans likelihood of cancer.
In the transactions between scientists and the general public, where influence flows in both directions, we see how advances in graphical display pioneered in the scientific literature were adopted by the mass media, and how advances in the media have been unfortunately slow to catch on among scientists.


