Howard Wainer - Visual Revelations: Graphical Tales of Fate and Deception from Napoleon Bonaparte to Ross Perot
Here you can read online Howard Wainer - Visual Revelations: Graphical Tales of Fate and Deception from Napoleon Bonaparte to Ross Perot full text of the book (entire story) in english for free. Download pdf and epub, get meaning, cover and reviews about this ebook. year: 2011, publisher: Copernicus, genre: Home and family. Description of the work, (preface) as well as reviews are available. Best literature library LitArk.com created for fans of good reading and offers a wide selection of genres:
Romance novel
Science fiction
Adventure
Detective
Science
History
Home and family
Prose
Art
Politics
Computer
Non-fiction
Religion
Business
Children
Humor
Choose a favorite category and find really read worthwhile books. Enjoy immersion in the world of imagination, feel the emotions of the characters or learn something new for yourself, make an fascinating discovery.

- Book:Visual Revelations: Graphical Tales of Fate and Deception from Napoleon Bonaparte to Ross Perot
- Author:
- Publisher:Copernicus
- Genre:
- Year:2011
- Rating:3 / 5
- Favourites:Add to favourites
- Your mark:
Visual Revelations: Graphical Tales of Fate and Deception from Napoleon Bonaparte to Ross Perot: summary, description and annotation
We offer to read an annotation, description, summary or preface (depends on what the author of the book "Visual Revelations: Graphical Tales of Fate and Deception from Napoleon Bonaparte to Ross Perot" wrote himself). If you haven't found the necessary information about the book — write in the comments, we will try to find it.
Howard Wainer: author's other books
Who wrote Visual Revelations: Graphical Tales of Fate and Deception from Napoleon Bonaparte to Ross Perot? Find out the surname, the name of the author of the book and a list of all author's works by series.


Visual Revelations: Graphical Tales of Fate and Deception from Napoleon Bonaparte to Ross Perot — read online for free the complete book (whole text) full work
Below is the text of the book, divided by pages. System saving the place of the last page read, allows you to conveniently read the book "Visual Revelations: Graphical Tales of Fate and Deception from Napoleon Bonaparte to Ross Perot" online for free, without having to search again every time where you left off. Put a bookmark, and you can go to the page where you finished reading at any time.
Font size:
Interval:
Bookmark:
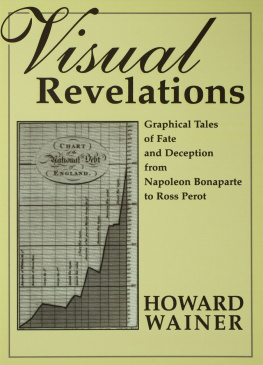
Visual Revelations
![]()
Visual Revelations
Graphical Tales of Fate and Deception from Napoleon Bonaparte to Ross Perot
Howard Wainer
![]()
Originally published in 1997.
1997 Howard Wainer
All rights reserved. No part of this book may be reproduced in any form, by photostat, microform, retrieval system, or any other means, without the prior written permission of the publisher.
Lawrence Erlbaum Associates, Inc.
10 Industrial Avenue
Mahwah, New Jersey 07430
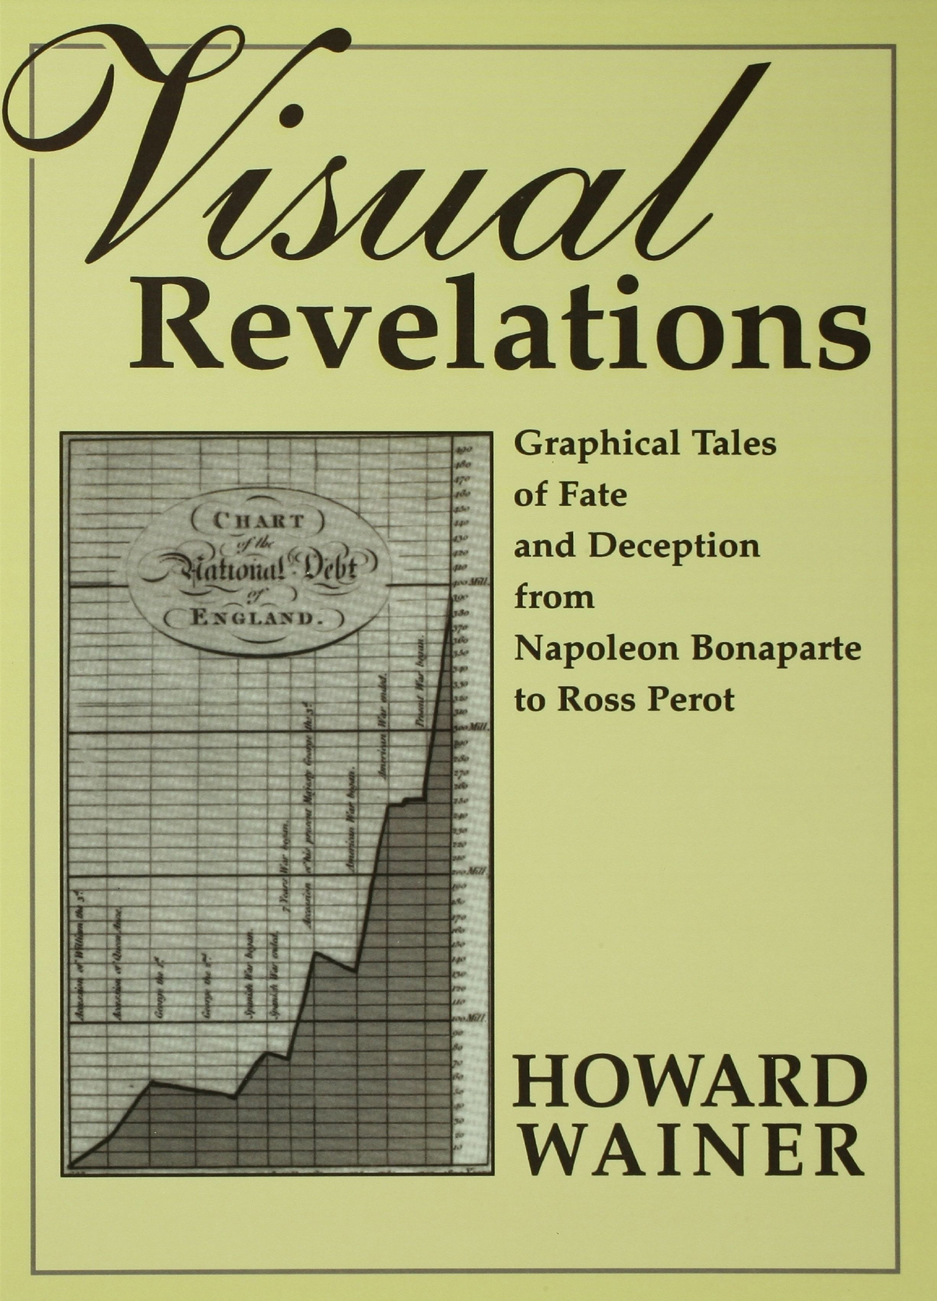
About the cover: Chart of the National Debt of England, which appeared as plate 20, opposite p. 83 in William Playfairs Commercial and Political Atlas (third edition), published in London in 1801. This beautifully executed line chart uses the innovation of an irregularly spaced grid along the time (horizontal) axis to demark events of important economic consequence. The inexorable conclusion we draw is that war was bad for Englands national debt.
Library of Congress Cataloging-in-Publication Data
Wainer, Howard.
Visual revelations : graphical tales of fate and deception from Napoleon Bonaparte to Ross Perot / Howard Wainer.
p. cm.
Originally published: New York: Copernicus, 1997.
Includes bibliographical references and index.
ISBN 0-8058-3878-3 (cloth: alk. paper)
1. Mathematical statisticsGraphic methods. I. Title.
QA276.3.W35 2000
001.4226dc21
00-056185
10 9 8 7 6 5 4 3 2 1
To Linda and Sam

The writing of this book spans almost twenty-five years. In that time an enormous number of intellectual debts have accumulated. I am delighted to be able to acknowledge my gratitude to the many who have contributed to my interest in and understanding of graphics.
The path began with John W. Tukey, who asked me to act as a discussant at a symposium on exploratory data analysis he had organized in 1972. Feeling that discussing the statistical technology of the foremost leaders in that field was an overreach for someone only barely out of graduate school, I decided to center my discussion on the need to verify the efficacy of graphical innovations experimentally. Fred Mosteller, who was also part of the symposium, suggested that I publish my findings. I did, and thus my graphical career began. That article came to the attention of Albert Biderman, who was looking for someone to run a research project at the Bureau of Social Science Research on the uses of graphics for social reporting. For many reasons this seemed like an interesting path to follow, so I agreed enthusiastically to join, and moved to Washington. One product of this project was the translation of Jacques Bertins monumental Semiologie Graphique into English, on which Bill Berg and I collaborated happily. The ideas I absorbed from Bertin and Tukey remain two of the principal legs supporting the seat of my graphical experience.
The third leg is Edward Tufte. I first met Edward when he gave a lecture on improving data display at the University of Chicago in 1977. Although his thinking on graphics was still at an early stage, his ideas had a profound influence on me; ) have their origins with Tufte. I am grateful indeed for his permission to reprint his figures. There is no one whose work I admire more than Tuftes. His three books (1983, 1990, 1997) are a wonderful and beautiful manifestation of his thoughts and taste.
During the course of the Graphics Social Reporting Project (19771980), I met with many of the principal workers in statistical had its origin in a piece that we cowrote; I am pleased that Al has given his permission to reuse it here. Many of the ideas presented in this book are my interpretations of his Delphic suggestions. Of course, he should not be held responsible for how Ive used them.
Since 1980 I have been employed by the Educational Testing Service. Although only a little of my work there is directly related to data display, I have always been accorded time and support to pursue my graphical interests. Without the forbearance of my employer this book would never have been completed, and to that I am indebted. I would specifically like to express my appreciation to the trustees of the Educational Testing Service, who through the 1990 Senior Scientist Award afforded me additional freedom to pursue various graphical notions. In the preface to his Sketches from a Life, the storied diplomat and historian George Kennan quoted Anton Chekov, a doctor, who wrote that while medicine was his wife, literature was his mistress. Kennan added that his situation was similar, but his mistress was neither as beautiful nor as varied as Chekovs. My relationship with statistics and graphics follows in the same pattern, although trailing far behind in breadth and depth as well as beauty.
In many books one often sees statements like To Zelda, my long-suffering wife, for late dinners and her understanding that following my muse precludes doing the dishes. Well, I would like to thank my wife, Linda Steinberg, for her intolerance. She has read everything in here, as well as much that happily is not. She has been intolerant of pompous or unclear prose, of sloppy thinking, and of pointless discussion. Her contribution, in short, was not to the infrastructure that allowed me to write this book, but rather to its intellectual content. My gratitude, which is immense, is for her direct contributions toward making this a better book. Any late dinners I usually ended up cooking myself.
Over long periods of time, a number of my colleagues have provided bits and pieces of help, which when aggregated have become substantial. Principal among these is my former student, long-term friend, and frequent collaborator, David Thissen. We have written so much together that it is often impossible to determine on whose word processor the prose, and indeed the ideas, originated. I believe that the prose in this book is mostly mine, but some of the ideas are surely Davids. Happily, he has so many ideas that he doesnt begrudge my borrowing a few.
In addition, I would like to thank for their comments, suggestions, and contributions to various pieces Jill Callahan, Jeff Douglas, John Durso, Andrew Ehrenberg, Molson Export, Lawrence Frase, Martin Gilchrist, Charles Lewis, Alan MacEachren, John Mazzeo, Bob Mislevy, Carol Myford, Jim Ramsay, John Rolph, Mary Vaiana, Steven Wang, Warren Willingham, and Denise Woerner. I would also like to thank Patricia Clare Haskell for advice of many sorts; also for letting me keep in most of the semicolons.
There are many staff members at Springer-Verlag who have had an important role in bringing this book to market in its current form. Principal among them are Steven Pisano (production) whose good humor and sharp eye were instrumental in producing a work that was as good as he could make it; Karen Philips (designer) who not only produced the cover but also took seriously my sometime amateurish suggestions; and Martin Gilchrist (editor) whose enthusiasm for the project and the subject brought me to Springer in the first place.
Last, it is important to note the genesis of much of this books contents. through 20 are variations on columns I wrote in the statistics magazine Chance over the time period 1990 through 1996.
Next pageFont size:
Interval:
Bookmark:
Similar books «Visual Revelations: Graphical Tales of Fate and Deception from Napoleon Bonaparte to Ross Perot»
Look at similar books to Visual Revelations: Graphical Tales of Fate and Deception from Napoleon Bonaparte to Ross Perot. We have selected literature similar in name and meaning in the hope of providing readers with more options to find new, interesting, not yet read works.
Discussion, reviews of the book Visual Revelations: Graphical Tales of Fate and Deception from Napoleon Bonaparte to Ross Perot and just readers' own opinions. Leave your comments, write what you think about the work, its meaning or the main characters. Specify what exactly you liked and what you didn't like, and why you think so.