Other books by Kenneth Field
Landmarks in Mapping, ed.
Cartography.
Foreword: Wandering multiplicity Alberto Cairo
I could begin a foreword to Kens splendid Thematic Mapping: 101 Inspiring Ways to Visualise Empirical Data by referring to master mapmaker and educator Mark Monmoniers admonitions about all maps being white lies or Alfred Korzybskis warning that maps arent territories; as for a representation to be identical to the reality it stands for, itd need to be that reality itself. Both sayings are true but have become tired clichs through misuse, overuse, and obliviousness to what their authors wrote before and after them. We live in a time when brief slogans and witticisms often are considered deep wisdom. Devoid of their context, even the words of great thinkers become hollow and commoditized in that manner.
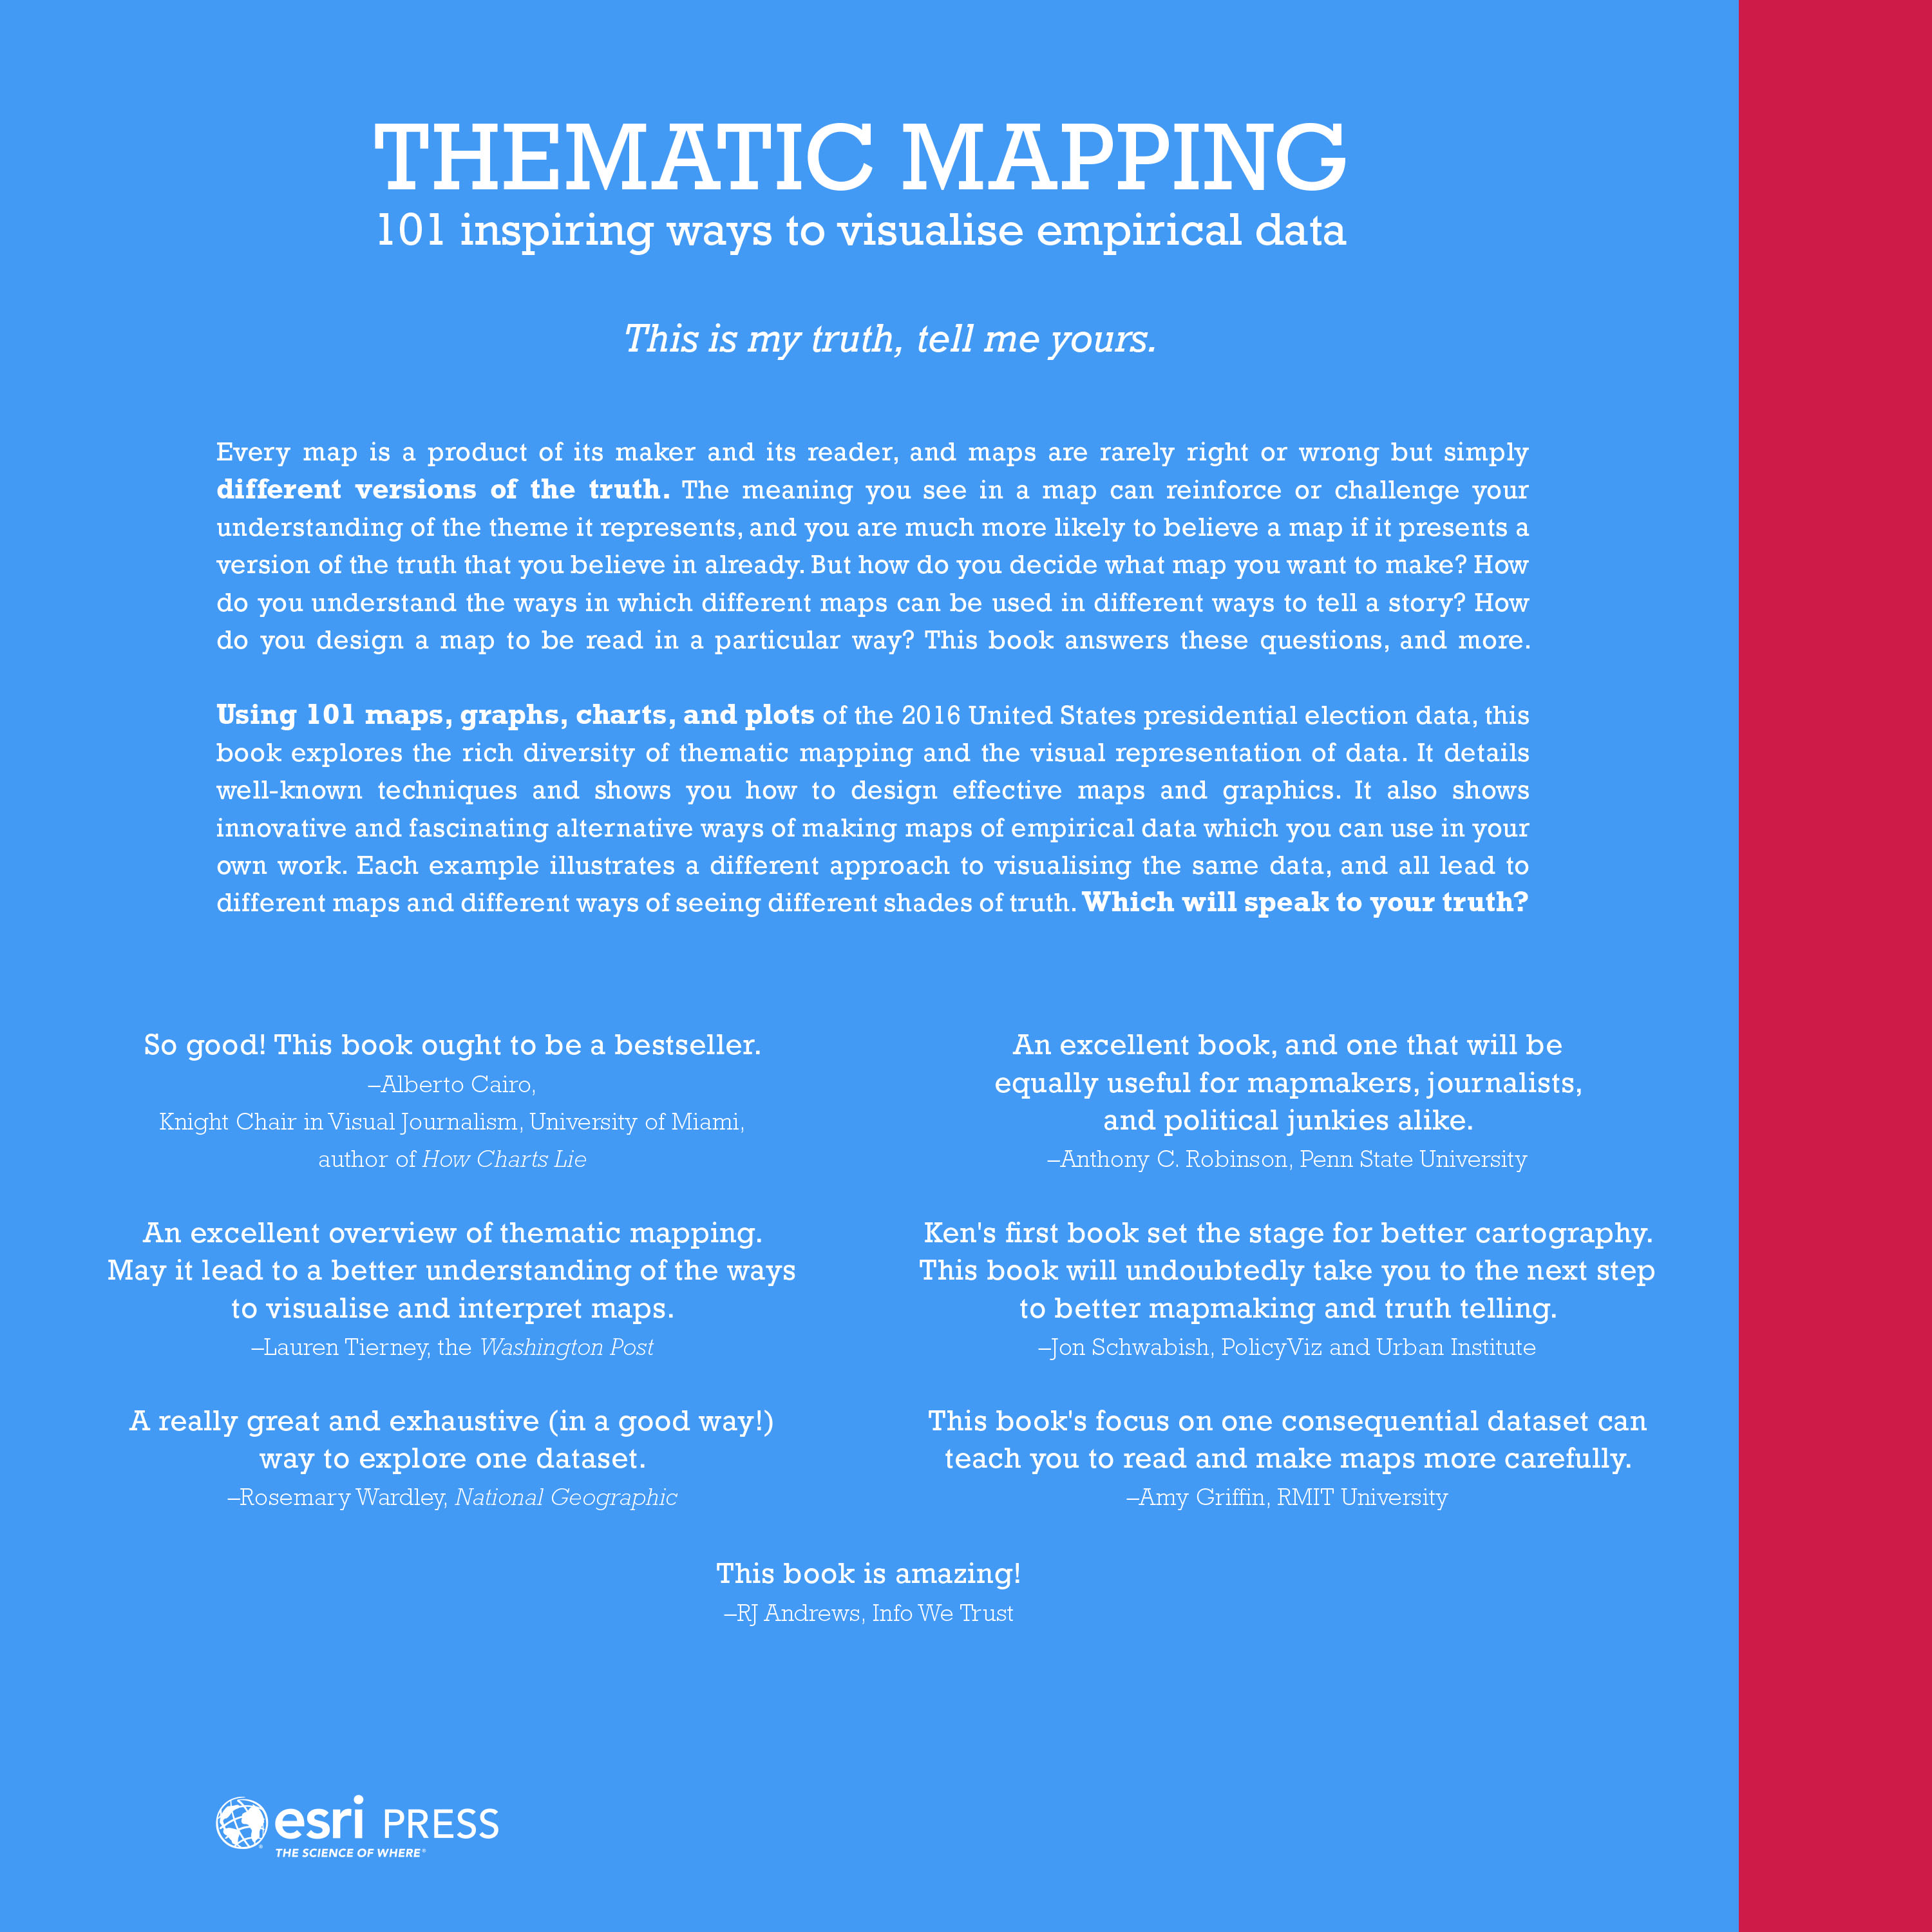
'This is my truth, tell me yours' is no hollow slogan. On the contrary, its one of the most extensive, systematic, and thorough demonstrations Ive seen of what cartographers and information designers have said for decades: theres no perfect graphic, and not only because a map cant be a territory because of the territorys endless complexity or because of the obvious limitations of our helplessly imperfect maps. Its also because the effectiveness of any visual display of information doesnt depend just on the quality of the data it contains or on the honesty of the adeptness of its creator but also on who views it. A picture isnt worth a thousand words to audiences who dont know how to read it.
Moreover, there is often a multiplicity of possible interpretations of any single phenomenon. Shouldnt then the graphical representations of that phenomenon also be multiple, as each graphic might cast light on the phenomenon in a unique manner? Ken takes all these ideas seriously, so Thematic Mapping offers a multifaceted grand tour of alternative maps of the same topic.
This book is also a lesson on cartographic reasoning and decision-making. All its examples illuminate and exemplify varied aspects of the craft. Kens cheerfuland occasionally ironicnotes paired with each map are of great help. I easily can see this book adopted as an introduction to mapmaking courses. Itll help students understand the relative strengths and weaknesses of various types of thematic mapswhich are always dependent on the nature of the information displayed and their goalsand the many trade-offs designers face in their daily practice.
This foreword would be a disservice to you if I didnt emphasise how beautiful the maps are that this book contains. It seems that people who visualise or write treatises about it tend to downplay the joys that great graphics provoke. I write 'beautiful', and not uppercase 'Beautiful', because I deeply distrust idealism in philosophy, the ideology that makes 'Beauty' a vaporous entity or quality independent from its observers.
I have no problem with the circular argument that 'beautiful' is simply whatever a human beingor several human beingsperceives, feels, and describes as beautiful. Sensual pleasure often is looked down upon by stern prophets of visualisation orthodoxy who, lost in their platonic caverns, seem to believe that sheer enjoyment has no value on its own and, therefore, ought to be either ignored or always secondary to bare clarity.
Most of the maps in Thematic Mapping are indeed clear, enabling insights and permitting exploration of data, but others are playful or quirky experiments, and they arent lesser works because of that; they are experimental wanderings and, as J. R. R. Tolkien wrote, not all those who wander are lost. Thematic Mapping teaches us to appreciate and embrace multiplicity and wandering, and its a wondrous book because of it.
Professor Alberto Cairo is the Knight Chair in Visual Journalism at the School of Communication of the University of Miami, where he teaches courses on infographics and data visualisation. He has authored several best-selling books, including, most recently, How Charts Lie (2019). He has held senior positions at various high-profile news media outlets and won numerous awards during his time leading the Interactive Infographics Department at El Mundo. He can be found on Twitter at @albertocairo.
Esri Press, 380 New York Street, Redlands, California 92373-8100Copyright 2021 Esri
All rights reserved.e-ISBN: 9781589485587The information contained in this document is the exclusive property of Esri unless otherwise noted. This work is protected under United States copyright law and the copyright laws of the given countries of origin and applicable international laws, treaties, and/or conventions. No part of this work may be reproduced or transmitted in any form or by any means, electronic or mechanical, including photocopying or recording, or by any information storage or retrieval system, except as expressly permitted in writing by Esri. All requests should be sent to Attention: Contracts and Legal Services Manager, Esri, 380 New York Street, Redlands, California 92373-8100, USA.The information contained in this document is subject to change without notice.US Government Restricted/Limited Rights: Any software, documentation, and/or data delivered hereunder is subject to the terms of the License Agreement. The commercial license rights in the License Agreement strictly govern Licensees use, reproduction, or disclosure of the software, data, and documentation. In no event shall the US Government acquire greater than RESTRICTED/LIMITED RIGHTS. At a minimum, use, duplication, or disclosure by the US Government is subject to restrictions as set forth in FAR 52.227-14 Alternates I, II, and III (DEC 2007); FAR 52.227-19(b) (DEC 2007) and/or FAR 12.211/12.212 (Commercial Technical Data/Computer Software); and DFARS 252.227-7015 (DEC 2011) (Technical Data Commercial Items) and/or DFARS 227.7202 (Commercial Computer Software and Commercial Computer Software Documentation), as applicable. Contractor/Manufacturer is Esri, 380 New York Street, Redlands, CA 92373-8100, USA.@esri.com, 3D Analyst, ACORN, Address Coder, ADF, AML, ArcAtlas, ArcCAD, ArcCatalog, ArcCOGO, ArcData, ArcDoc, ArcEdit, ArcEditor, ArcEurope, ArcExplorer, ArcExpress, ArcGIS, ArcGIS CityEngine, arcgis.com, ArcGlobe, ArcGrid, ArcIMS, ARC/INFO, ArcInfo, ArcInfo Librarian, ArcLessons, ArcLocation, ArcLogistics, ArcMap, ArcNetwork, ArcNews, ArcObjects, ArcOpen, ArcPad, ArcPlot, ArcPress, ArcPy, ArcReader, ArcScan, ArcScene, ArcSchool, ArcScripts, ArcSDE, ArcSdl, ArcSketch, ArcStorm, ArcSurvey, ArcTIN, ArcToolbox, ArcTools, ArcUSA, ArcUser, ArcView, ArcVoyager, ArcWatch, ArcWeb, ArcWorld, ArcXML, Atlas GIS, AtlasWare, Avenue, BAO, Business Analyst, Business Analyst Online, BusinessMAP, CommunityInfo, Database Integrator, DBI Kit, EDN, Esri, esri.com, EsriTeam GIS, Esri
The GIS Company, EsriThe GIS People, EsriThe GIS Software Leader, FormEdit, GeoCollector, Geographic Design System, Geography Matters, Geography Network, geographynetwork.com, Geoloqi, Geotrigger, GIS by Esri, gis.com, GISData Server, GIS Day, gisday.com, GIS for Everyone, JTX, MapIt, Maplex, MapObjects, MapStudio, ModelBuilder, MOLE, MPSAtlas, PLTS, Rent-a-Tech, SDE, See What Others Cant, SML, SourcebookAmerica, SpatiaLABS, Spatial Database Engine, StreetMap, Tapestry, the ARC/INFO logo, the ArcGIS Explorer logo, the ArcGIS logo, the ArcPad logo, the Esri globe logo, the Esri Press logo, The Geographic Advantage, The Geographic Approach, the GIS Day logo, the MapIt logo, The Worlds Leading Desktop GIS, Water Writes, and Your Personal Geographic Information System are trademarks, service marks, or registered marks of Esri in the United States, the European Community, or certain other jurisdictions. Other companies and products or services mentioned herein may be trademarks, service marks, or registered marks of their respective mark owners.For purchasing and distribution options (both domestic and international), please visit esripress.esri.com.166528For Linda, and Wisley.


