Bayes' Theorem:
A Visual Introduction for Beginners
Dan Morris
Bayes' Theorem: A Visual Introduction for Beginners by Dan Morris
Published by Blue Windmill Media
2016 Blue Windmill Media
All rights reserved. No portion of this book may be reproduced in any form without permission from the publisher, except as permitted by Canadian copyright law.
For permissions contact:
matthew@bluewindmill.co
Cover by Blue Windmill Media
Contents
Front-Matter: Don't Skip!
Examples
Bonus Stuff You'll Like
Bayes Everyday
If youve recently searched for something on Google, Bayes' Theorem was used to display your search results.
The same is true for those recommendations on Netflix.
Hedge funds? Self-driving cars? Search and rescue?
Bayes' Theorem is used in all of the above and more.
At its core, Bayes' Theorem is a simple mathematical formula that has revolutionized how we understand and deal with uncertainty. If life is seen as black and white, Bayes' Theorem helps us think about the gray areas. When new evidence comes our way, it helps us update our beliefs and create a new belief .
Ready to dig in and visually explore the basics? Lets go.
Dont Waste Your Time
A few points to help you make the most of this booklet:
- CHANGE YOUR SETTINGS. If you are reading on a Kindle E-reader, change your settings! It will make reading this booklet MUCH EASIER. For spacing, select the mid-range option (on Kindle Paperwhite, the middle option). For margins, select the widest option. For orientation, select portrait. For font, select Bookerly, and font size select the third smallest option (at least on the Kindle Paperwhite).
- This booklet is designed as a visual introduction to Bayes' Theorem. It is for BEGINNERS. If you already have a general understanding of the Theorem, you might not get much out of this book.
- You dont need to read front to back! Skip around to what you find the most helpful.
Welcome To This Guide
Welcome to Bayes' Theorem: A Visual Introduction for Beginners . This booklet is packed with examples and visual aids to help clarify what Bayes' Theorem is and how it works. At its core, Bayes' Theorem is very simple and built on elementary mathematics.
Before we dig into different definitions, it needs to be stated that Bayes' Theorem is often called Bayes' Rule or Bayes' Formula. So, dont be confused - they are the same, and we will be using both theorem and formula throughout this booklet. Second, we need to make it clear that Bayes' Theorem is a law of probability theory. It helps us work with, revise, and understand probabilities when we are presented with new evidence.
Practically speaking, the theorem helps us quantify or put a number on our skepticism and make more informed, rational choices. It helps us answer the following:
When we encounter new evidence, how much should it change our confidence in a belief?
Here are a few examples:
- You just had a test for cancer and it came back positive. What is the probability that you have cancer if the test is positive?
- Your friend has a new dog and when you visit she slobbers all over you, but does that mean the dog likes you? What is the probability that the dog likes you given that she licks you?
- Your friend claims that stock prices will decrease if interest rates increase. What is the probability stock prices will decrease if interest rates increase?
- You were just pulled over by the police and given a breathalyzer test. It came back positive. What is the probability you are truly drunk, given that the test is positive?
Bayes' Theorem Explained: 4 Ways
Here are a few ways Bayes' Theorem can be explained:
- Bayes' Theorem helps us update a belief based on new evidence by creating a new belief .
- Bayes' Theorem helps us revise a probability when given new evidence.
- Bayes' Theorem helps us change our beliefs about a probability based on new evidence.
- Bayes' Theorem helps us update a hypothesis based on new evidence.
The only problem? Applying the theorem is not intuitive, at least not for most people. This is where visualizing a problem that entails using Bayes' Theorem can be a BIG HELP.
Visual Aids
When working with small amounts of data there are a few different visual aids you can use:
- Venn diagrams
- Decision trees
- Letters (e.g., H, T, T, T for head/tail coin flips)
- Physical Objects (e.g., real coins)
In this booklet, well be using Venn diagrams and decision trees. Venn diagrams are an excellent way to help us visually understand problems.
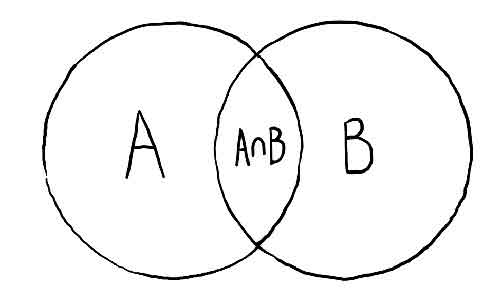
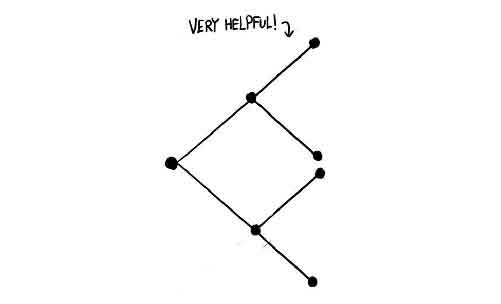
On the other hand, decision trees are a great tool that can help us solve problems where probabilities are not provided and must be discovered.
They are a fantastic visual aid that, for many students of probability, can help unblock areas of frustration and confusion.
Booklet Structure
Here is how we have structured this booklet:
- There are two Problem and Answer sections and a bonus section. Each section deals with a popular way Bayes' Theorem is typically presented in introductory textbooks. * All numbers provided in each problem are hypothetical. Some are pegged close to realistic statistics, but for the sake of clarity and ease we have adjusted each number.
- Each Problem and Answer section has three scenarios. To help you fully understand each question type, we will work through 3 scenarios. The idea behind this to help drive the problem-solving process home. The scenarios include the flu, breathalyzer test, and peacekeeping.
- And for those who are interested, we have included a few additional sections on understanding scenarios, the history of Bayes' Theorem, fascinating stories and uses, and even a few tips on how to think like a Bayesian in real life.
- We have also included an extended definitions section, which includes a Proof for Bayes' Theorem.
- To round out this booklet, we have included a list of recommended readings for those looking to dive deeper into the Theorem and learn more about its fascinating uses and history.
A Visual Intro: Part 1
If you are confused with the concept of Bayes' Theorem, this is a fantastic place to start. Before we dive into Example Section 1, lets take a look at Bayes' Theorem without using the formula. This visual introduction is an expanded version of this excellent video .
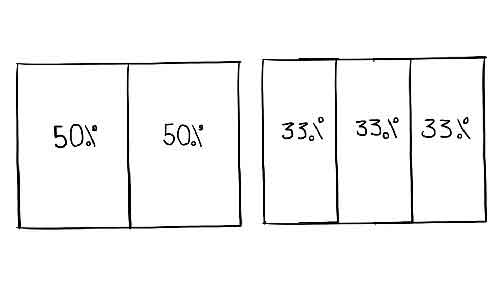
To begin, lets draw a rectangle. Dont get hung up on the shape - it could be any shape, but a rectangle is easy to work with. The area inside the rectangle represents all possible outcomes for our experiment. For example, if there are two possible outcomes that are equally probable, we would divide the rectangle into two equal halves. This means that each outcome has a 50% likelihood of occurring. Or, if there are three possible outcomes that are all equally probable, we would divide the rectangle into equal thirds. This would mean that each outcome has a 33.33% chance of occurring.
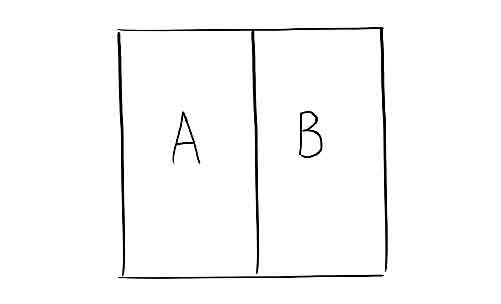
For this example, we are going to stick with two equal outcomes and title each outcome A and B, respectively.
Next page
