The FOUR-COLOR
THEOREM
and Basic
GRAPH THEORY
Chris McMullen, Ph.D.
Copyright
The Four-Color Theorem and Basic Graph Theory
Chris McMullen, Ph.D.
Copyright 2020 Chris McMullen, Ph.D.
monkeyphysicsblog.wordpress.com
improveyourmathfluency.com
chrismcmullen.com
All rights are reserved.
Zishka Publishing
Paperback Edition ISBN: 978-1-941691-09-0
Mathematics > Four-Color Theorem
Mathematics > Graph Theory
Contents
Introduction
This book will take you on a tour of the four-color theorem and related concepts from graph theory. Numerous illustrations are provided to help you visualize important ideas. Concepts are explained in clear, simple terms. No prior knowledge of graph theory is assumed.
Following is a sample of what you will find in this book:
what the four-color theorem is
a novel explanation for why the four-color theorem holds (Chapter 27)
the reason for working with graphs instead of maps
what triangulation is and the reason behind it
visual examples of Kempe chains and Kempes attempted proof
the three-edges theorem : a simplified approach to the four-color theorem
cool concepts like quadrilateral switching and vertex splitting
the distinction between planar graphs and nonplanar graphs
how to determine if a graph is a maximal planar graph or not
Eulers formula and its relation to maximal planar graphs
explanations of Kuratowskis theorem and Wagners theorem
complete graphs and complete bipartite graphs
a survey of a few named graphs such as the Fritsch and Errera graphs
how some maximal planar graphs can be trivially colored
a simple algorithm for four-coloring a maximal planar graph (Chapters 22 and 24)
counting how many ways a graph can be colored using no more than four colors
comparing the coloring of a graph to a logic puzzle
Hamiltonian cycles and polygon forms of maximal planar graphs
what a separating triangle is and how to use it
May you enjoy this tour of the four-color theorem and basic graph theory.
1 Maps vs. Graphs
In a geography class, a map shows relationships between various regions, such as:
the border surrounding each region
the size and shape of each region
which regions share borders with one another
where one region is located relative to other regions
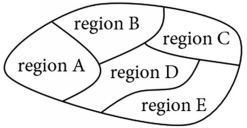
Notice that were using the term region . The regions could be countries on a continent, but they could be states or provinces of a nation or they could be counties that make up a state. The term region allows for generic use. Of the features mentioned above, the only one that we will be concerned with in this book is which regions share borders with one another.
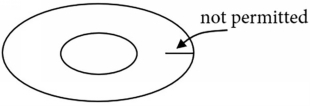
In mathematics, especially as it relates to the four-color theorem (which well introduce in Chapter 2), maps and regions have slightly different meanings than they do in geography. For one, we wont allow a region to consist of two disjointed areas. For example, the United States wouldnt meet our definition of a region because Alaska and Hawaii are separated from the other 48 states. Another difference between math and geography is that we will require the regions of a map to be contiguous; there cant be gaps between the regions like lakes. A map doesnt need to show real places; we will imagine different ways maps can be drawn.
For a map, we will use the term edge to refer to any line or curve that separates one region from another region or any line or curve that separates an exterior region from the region outside of the map. Each edge begins at one vertex and ends at another vertex. Every line or curve on a map must adhere to this definition of an edge.
For a map, we will use the term vertex to refer to a point where three or more edges intersect. In plural form these points are called vertices . This definition is for a map . (When we learn about graphs, we will see that a vertex has a different definition for a graph , although it will still be a point where edges intersect.)
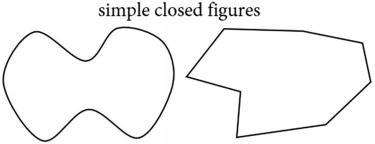
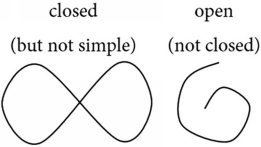
We will require each region of a map as well as the border that surrounds all of the regions to be a simple closed figure. A closed figure divides the plane into two distinct areas: the area inside the figure and the area outside the figure. In contrast, an open figure does not. By simple , we mean that the border of a single region doesnt cross itself like a figure eight; however, two different regions may join to form a figure eight. Some common examples of simple closed figures include circles, polygons, and ellipses, but the regions dont need to be common shapes; they just need to be simple closed figures.
The only information that a map contains which is relevant to the four-color theorem (to be introduced in Chapter 2) is which regions share borders with which other regions. As far as this is concerned, it is simpler to redraw a map in the form of a graph . The distinction between a graph and a map is that a graph only shows which regions are neighbors; it doesnt show the size or shape of regions, relative locations, or other information that we wont need.
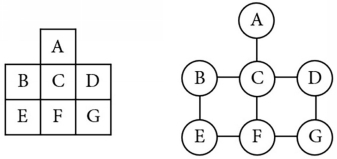
Any map can be represented by a graph as follows:
For each region of the map, on the graph we will draw a small circle and place the corresponding label inside of it.
For each pair of regions on the map that share an edge, on the graph we will connect these corresponding circles with a line or curve.
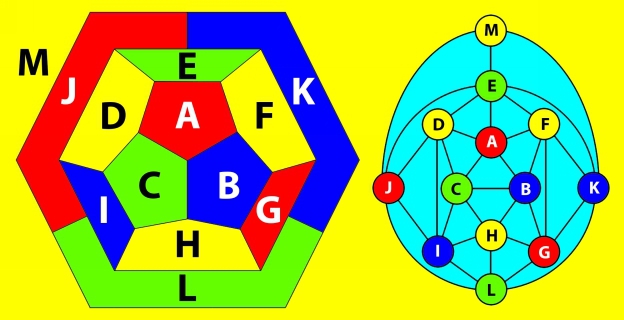
The example below shows a map on the left and its corresponding graph on the right.
Notice how a graph corresponds to a map:
On a map, each region is a face (a simple closed figure surrounded by edges). On a graph, each region is a vertex (a small circle where edges intersect).
On a map, adjacent regions share an edge. On a graph, the edges indicate which pairs of regions share edges on the map. Any line or curve that connects two vertices on a graph is considered to be an edge .
On a map, three or more edges intersect at a point called a vertex. On a graph, three or more edges surround a face .


