Contents
Guide
Thank you for downloading this Simon & Schuster ebook.
Get a FREE ebook when you join our mailing list. Plus, get updates on new releases, deals, recommended reads, and more from Simon & Schuster. Click below to sign up and see terms and conditions.
CLICK HERE TO SIGN UP
Already a subscriber? Provide your email again so we can register this ebook and send you more of what you like to read. You will continue to receive exclusive offers in your inbox.
We hope you enjoyed reading this Simon & Schuster ebook.
Get a FREE ebook when you join our mailing list. Plus, get updates on new releases, deals, recommended reads, and more from Simon & Schuster. Click below to sign up and see terms and conditions.
CLICK HERE TO SIGN UP
Already a subscriber? Provide your email again so we can register this ebook and send you more of what you like to read. You will continue to receive exclusive offers in your inbox.

Adams Media
An Imprint of Simon & Schuster, Inc.
57 Littlefield Street
Avon, Massachusetts 02322
www.SimonandSchuster.com
Copyright 2018 by Simon & Schuster, Inc.
All rights reserved, including the right to reproduce this book or portions thereof in any form whatsoever. For information address Adams Media Subsidiary Rights Department, 1230 Avenue of the Americas, New York, NY 10020.
First Adams Media hardcover edition December 2018
ADAMS MEDIA and colophon are trademarks of Simon & Schuster.
For information about special discounts for bulk purchases, please contact Simon & Schuster Special Sales at 1-866-506-1949 or .
The Simon & Schuster Speakers Bureau can bring authors to your live event. For more information or to book an event contact the Simon & Schuster Speakers Bureau at 1-866-248-3049 or visit our website at www.simonspeakers.com.
Graphics by Chris Monahan
Cover design by Heather McKiel
Cover images Clipart.com; Shutterstock /Babich Alexander, Macrovector, Microone, Iamnee
Library of Congress Cataloging-in-Publication Data
Borman, David, author.
Statistics 101 / David Borman.
Avon, Massachusetts: Adams Media, 2018.
Series: Adams 101.
Includes index.
LCCN 2018037190 (print) | LCCN 2018039029 (ebook) | ISBN 9781507208175 (hc) | ISBN 9781507208182 (ebook)
Subjects: LCSH: Statistics. | Mathematical statistics.
Classification: LCC QA276.12 (ebook) | LCC QA276.12 .B6678 2018 (print) | DDC 519.5--dc23
LC record available at https://urldefense.proofpoint.com/v2/url?u=https-3A__lccn.loc.gov_2018037190&d=DwIFAg&c=jGUuvAdBXp_VqQ6t0yah2g&r=eLFfdQgpHVW0iSAzG8F-WtSjrFvCD9jGMJBHtzyExXhmHvwB7sjMCnFuKz95Uyqa&m=i_4-sqUtYR1dsHotRZbeuBf23AV9QMee2LEcIqKeRXA&s=A_1aSLk-vo4P_O-X8oNWS-w-ue_0pyuj7s-lkfQSXrY&e=
ISBN 978-1-5072-0817-5
ISBN 978-1-5072-0818-2 (ebook)
Many of the designations used by manufacturers and sellers to distinguish their products are claimed as trademarks. Where those designations appear in this book and Simon & Schuster, Inc., was aware of a trademark claim, the designations have been printed with initial capital letters.
INTRODUCTION
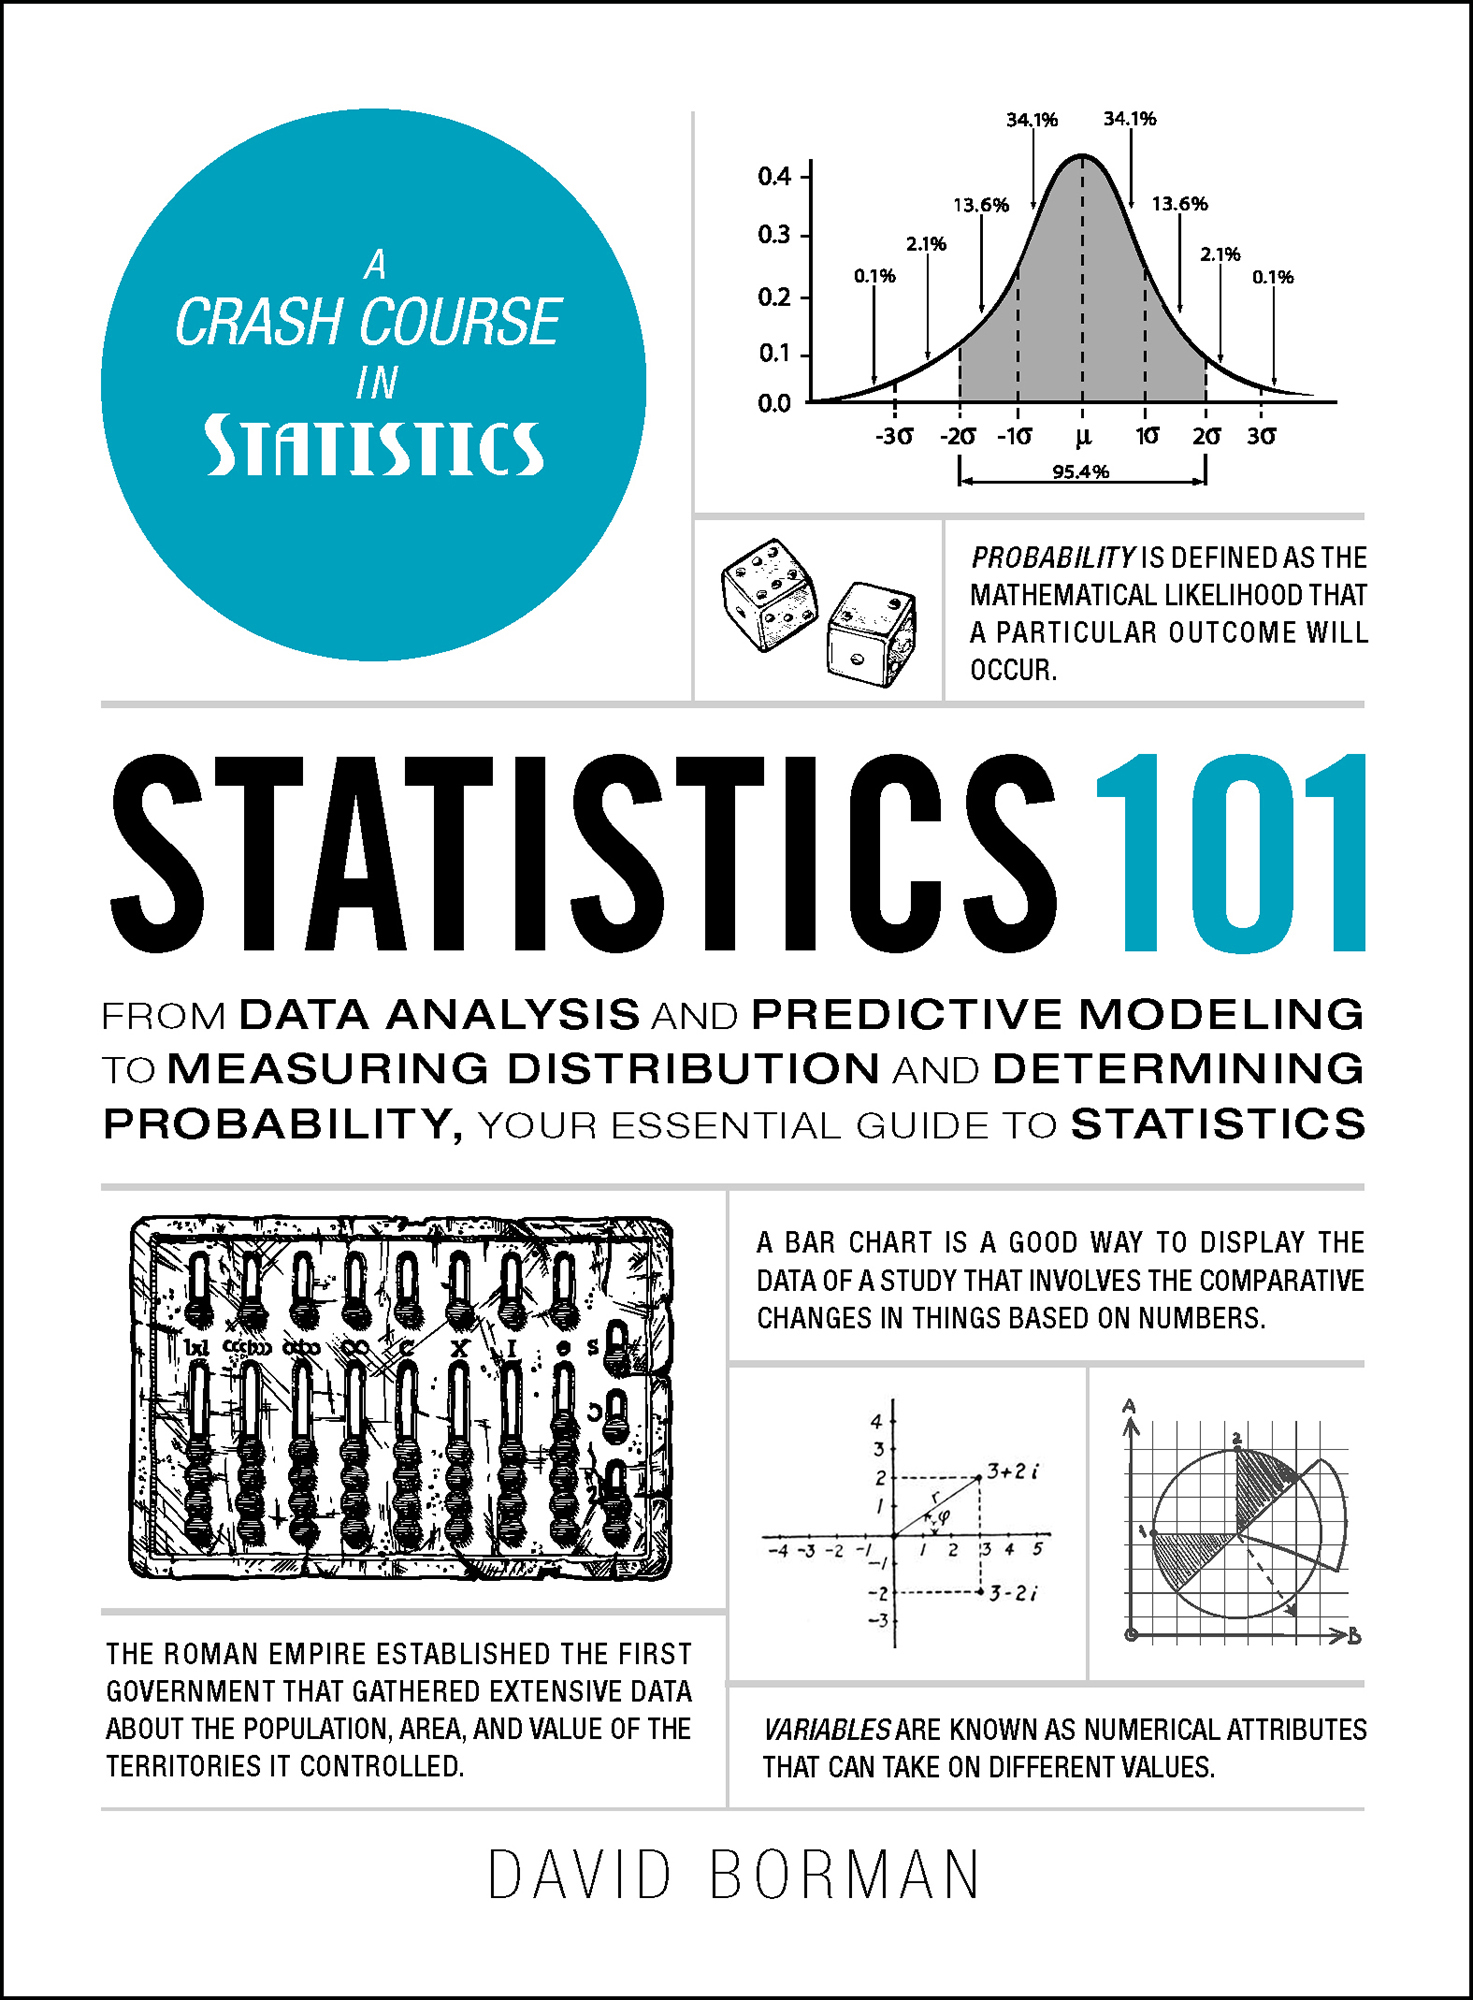
Data analysis , predictive modeling , and data science : these terms are splashed across the news, in books, and online. Theyre applications of a field of mathematics called statistics. Although the names of the applications are varied and diverse, the study and knowledge of statistics is at the core of these disciplines.
Statistics is the measuring of data and interpreting that data to prove or disprove a point. Thats it! Statisticians collect and work with large amounts of numbers and measurements. Then they calculate how the numbers relate to each other or how they affect each other.
If you know the basics of statisticswhat the numbers tell youand learn how to collect or obtain accurate, reliable, and good numbers-related facts, and if you further learn to use statistics to arrive at conclusions, then you are well on your way to developing a meaningful statistics-based analysis. This skill can be of great help to you at work, at school, or in your daily life.
This book is for you if youre new to statistics. Ill help you build your knowledge gradually. First, well look at core concepts, with each section covering a basic unit of knowledge of statistics. Each section is designed to stand alone, giving you the option of reading the book cover to cover for a comprehensive study. Once youve grasped the basics (or if you already know them), you can jump to a section youre interested in and read only the material you need to learn.
The book can be used if youre studying statistics in a high school or college course. It can also help you brush up if youve take a statistics class in the past, are now being exposed to statistics at work, and would like to know more without taking a full-length course on the subject.
Finally, there are some sections written for high school and college students on how to use statistics in school projects. These units are there to help you understand, design, and test what are called the quantitative research sections of assignments, sections that require a statistical analysis.
Read through the book in the order of the sections provided or jump to the section youd like to learn: either way, youre well on your way to gaining a full grasp of what statistics is and how its used in business, scientific, and academic studies!
THE BASICS OF STATISTICS
A Tool of Measuring
The science of statistics is used to analyze large groups of numbers. It can be used with spreadsheet software to build simple programsthese programs are called predictive models, and they can help do just that: use statistics to predict the most probable future outcomes of a set of circumstances. While predictive models, data analysis, and data science are different, they all use the same related statistical tools. With them, youll be able to get data and then provide a testing method to answer a variety of questions. Fundamentally, most statistical studies and models want to know how the numbers that make up the data relate to each other. Whats the average? How does the shape of the data look on a graph? And, possibly the most important in any study or research assignment: what does the data tell us?
STUDIES USE STATISTICS
The desktop computer became a reality in the 1980s. People were encouraged to get a desktop computer and were told that it would release users from mundane tasks, giving them more personal time. Well, that didnt happen. What did happen is that governments, companies, and individuals found that there was a great deal of data available to help these entities make decisions. Just like the classic question What came firstthe chicken or the egg?, you can argue the issue as What came first, the data or the question? In other words, did the data show that there is a question to be answered or are there questions that require data collection?
Unlike the chicken/egg conundrum, the answer to the data collection/study question is that they are both right. With all the data that is available, people can sit at their desks, analyze the data, and pose questions implied by it or answer questions posed by someone else. Before the age of the desktop computer, that work was being done, but only by those who had access to larger computers and who could pay the bill for the very expensive computer time. (In those days, computers sometimes took up rooms or even, in some cases, entire buildings.)

