1 Preface
An untold truth is, that most published strategies dont make money. Most of them work only on circumstances which occur very seldom. The VWAP Strategy or generally the Equilibrium Price Strategy works every day.
I wrote a VWAP indicator for Metatrader 5 (Mql5.com). I choosed a slim version and display VWAP only for the actual day. Other implementations which run over the whole displayed period crashed Metatrader.
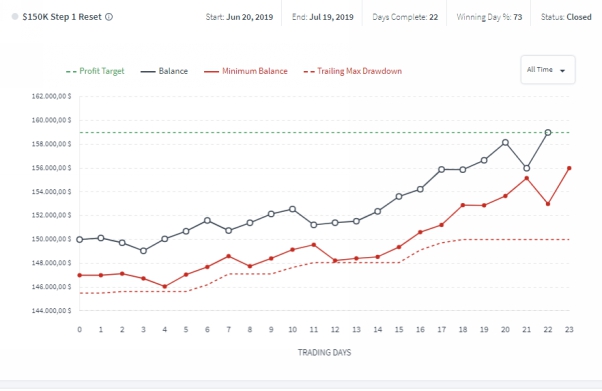
The below equity curve stems from the first step of qualification of TopStep Traders (funded trading). I reached $ 9000 in 22 days trading the Mini Dow Future only. It was achieved mainly by watching equilibrium prices (VWAP, Pivot Points, pre day lines, Volume Priofile) and watching trends in the minute chart by drawing trend lines. It shows that it is possible to get a positive expectation value even in an index with a high percentage of high frequency trading.
Fig. 1: Equity curve of Dow Jones Mini Futures trading by applying the strategy of equilibrium prices (first step of TopStep Traders to get a funded account).
WVAP is simply a price weighted by volume. It marks a fair price, i.e. a price where you are not supposed to trade.
WVAP works best with liquid assets as stock indices or blue chips, but also for currencies, but only if there is volume data present and the volume must be large enough. The strength is that VWAP is independent of time frame and it helps to reveal institutional activities. A drawback is that it needs precise volume data and there are different values for different starting times. In addition VWAP can be slightly different for related assets, eg. each VWAP of Dow Jones Cash, Mini Future and Micro Future differ. But every VWAP has its own value.
2 Disclaimer & Copyrights
Trading indices and currencies involves substantial risk. Losses are always part of the game. The advices in this book will not guarantee profits from trading. There is no trade recommendation or investment advice. All content in this book is for teaching and informational purposes only.
Before deciding to invest in the financial market, you should carefully consider your investment objectives. Your level of experience and your risk threshold. Dont invest money you cannot afford to lose. It is a fact that more than 80% of the European retail trader lose.
Your success using the strategy of this book depends on many factors. The author has no way of knowing how well you will do. Therefore he does not guarantee or imply you will get any earnings at all.
The short term trading presented here needs substantial routine to be successful. It is viable that you understand when the situation in the market does not allow trading.
All trademarks are trademarks of their respective owners. We use names in an editorial fashion only.
3 Time
I use CET (Central Europe Time) and EST (Eastern Time US). The time difference is 6 hours in normal situations. During summertime conversion this difference reduces to 5 hours. There might be a time jam in the depicted charts as brokers normally dont change their server time during the three weeks when US has already summer time and Europe does not have it yet. The same is valid for autumn.
VWAP has a different appearance for different starting times. Check for your timezone if price bounces often on VWAP or falls often back to VWAP. If so, your VWAP is correct.
4 Introduction
VWAP stands for V olume W eighted A verage P rice. VWAP shows an equilibrium price, i.e. a fair price, and this price is more dynamic than for example the point of control of a market- or volume profile. VWAP has the big advantage of not being dependent of timeframe. Whatever timeframe you chose, VWAP is the same. There are only few indicators being independent of time frame, as the Pivot Points for example. As VWAP needs precise volume data the displayed curve might not be very precise. If you compare the VWAP representation of Dow Jones Cash, Dow Jones Mini- and Micro-Futures there are some differences in representation. In such a case you have to watch the VWAP with the market of the largest volume, i.e. Dow Jones Cash market.
The formula of VWAP is
As you see there are very big numbers involved during the day. In the course of the day it may get less precise because of rounding errors. Many implementations may crash Metatrader because of the many calculations needed. Only one single error in volume data may shift the curve. So you must not look at VWAP at a line, rather think of it as a zone. In the figure below there is a typical error: In the left side I traded short when price dipped below VWAP in a TradingView representation. When I looked at the picture after the close of the stock exchange there was another picture. It is probably due to bad volume data. For a precise volume data stream you have to pay extra in TradingView. In any case VWAP is no signal line, it is a region of a fair price.

Fig. 4.1: Depending on the quality of the volume data VWAP might not be very precise. On the right the representation of the moment I traded. On the right side the representation after the close of the stock exchange. The signal at the left side was wrong. In addition it is important when VWAP starts. Depending on the starting time you get different curves.
VWAP divides a trading day in a long bias and short bias zone. If you orient to VWAP during trading you may foresee some strong rebounds or pullbacks. If price is above VWAP and you short, the danger of a sudden rebound is much larger as if the price was below VWAP and vice versa for the long case. By its nature as day divider you should be flat if price is near VWAP and you may not trade a cross of price with VWAP.
VWAP also may reveal institutional activity. And if you manage to spot institutional activity you are the king of the arena.
You can get the Swiss VWAPsimple for free from my website on mql5.com. It runs on Metatrader 5. Although I use only tick volume in the calculations this indicator works very well, at least for indices as German Dax or Dow Jones.
This book doesnt explain every indicator, you should be familiar with them. If not please read one of my other books The Opening Range Oriented Strategy.
This book is a working book and will have several releases, please check if you have the up to date version.
Actual version: 1.1.
5 Sources to learn from
There are many Youtube films or Facebook Sites which suggest you to buy an expensive crash course to learn trading. They mostly show very nice single trades and the life style of the instructors (mainly luxury cars), absolutely not related to trading. Dont believe these advertisements and dont spend money on them. First you have to find your own way of trading and second you cannot trust single trades. The only proof that somebody can consistently trade is an equity curve, and even an equity curve can be forged.
When starting trading you should concentrate mainly on the US-Trading veterans. These true gurus dont show you their live style. And dont think they are outdated. They are not at all, the principles they outline are still valid. First Linda Raschke. If you listen to her in Youtube you get more trading truth than from anywhere. She also tells you which literature you should read. A problem might be, that you dont understand the true gurus in the beginning due to too few knowledge about trading. So it is worth to spend some practice in trading to understand them. Another very important author is James Dalton. His book Mind over Markets is a corner stone in understanding equilibrium prices.



![Harry Boxer [Harry Boxer] - Profitable Day and Swing Trading: Using Price / Volume Surges and Pattern Recognition to Catch Big Moves in the Stock Market, + Website](/uploads/posts/book/124137/thumbs/harry-boxer-harry-boxer-profitable-day-and.jpg)
