This book is dedicated to all those who suffered great losses as a result of Sandy, and all those who rushed in to help.
CONTENTS
I was motivated to write this book after the experience of being interviewed repeatedly by the media in the weeks after the storm. Sandy raised some questions that I could answer from my perspective as an atmospheric scientist. These included questions about the details of the storm itself, and about what current science allows us to say (or does not) about Sandys relation to human-induced climate change. Other questions were broader, such as: what measures should be taken to protect against future Sandy-like disasters? I realized, by a few weeks after landfall, that I wanted to write about all these questionsboth those my technical expertise would allow me to address with some authority and those to which I could give only an opinion as an informed citizenin a book.
There is a little bit about me in the story. I am your narrator, and you may as well know whom youre dealing with. Ive tried not to beat you over the head with my personal politics, but I havent tried to keep them from showing, either. We scientists, like everyone else, have values, and those are going to come out one way or another. What is important is that we separate normative statements based on those values (statements about what we think people should do) from scientific statements that are not based on those values but that are as objective and evidence-based as we can make them (statements about how nature works). This book contains both kinds of statements. Without being fully explicit or formal about it, Ive tried to make it clear enough which are which.
Wind speeds are given mostly (but not exclusively) in knots, following the National Hurricane Center advisories. One knot is 1.15 mile per hour; 65 knots, NHCs estimate of Sandys winds at landfall (and the minimum threshold for a tropical cyclone to be called a hurricane) is about 75 miles per hour. One knot is also 0.51 meter per second. Distances are measured mostly, but not exclusively, in miles. Storm surge is measured in feet, while sea level rise is measured in both feet and meters.
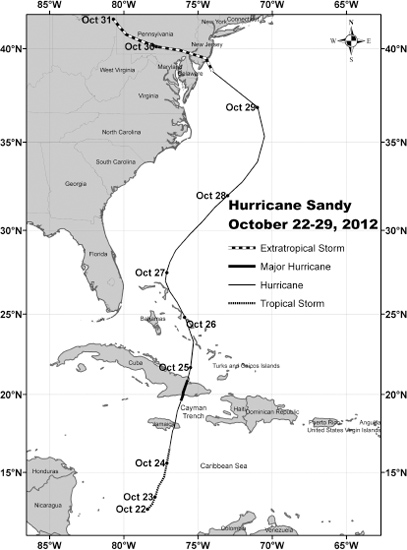
Map showing the track of Hurricane Sandy, starting from the time it was named as a tropical storm, on October 22, 2012. The line type categorizes the storm by type and intensity, as indicated in the legend. (Courtesy of Andrew Kruczkiewicz and Jerrod Lessel, track data from National Hurricane Center/NOAA)

Sandys maximum wind speed (thick curve, in knots, scale at right) and minimum surface pressure (thin curve, in hectoPascals, scale at left) as functions of time, given as dates in October on the x axis. The time of landfall is shown approximately by the vertical line, indicating 00 Universal Time on October 30. (Data from National Hurricane Center/NOAA)
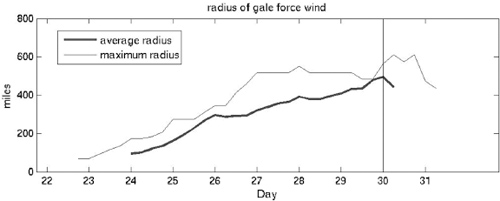
Sandys size, as measured by the radius of gale force (thirty-five-knot) wind (in miles, on the y axis), as a function of time (date in October, on the x axis). The radius of gale-force wind is measured separately in each quadrant of the storm (northeast, southeast, southwest, northwest); the thick curve is the average of the four values, while the thin curve is the maximum. The time of landfall is shown approximately by the vertical line, indicating 00 Universal Time on October 30. (Data from National Hurricane Center/NOAA)
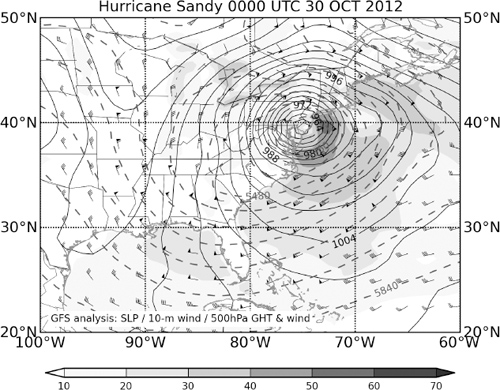
Weather map at the time of Sandys landfall, 00 Universal Time on October 30, 2012. The solid contours show mean sea level pressure, in hectoPascals; the dashed contours show geopotential height at the 500 hectoPascal pressure level (similar to the pressure field at a constant height of about three miles above the surface); the wind barbs indicate the wind speed in knots (triangular flag = fifty knots, full barb = ten knots, half barb = five knots) at the 500 hectoPascal level; and the shading indicates the wind speed at the surface, in knots, with the scale given at bottom. ( 2014 Chia-Ying Lee, data from NOAAs Global Forecast System)
On October 28, 2012, a giant, misshapen hurricane made a left turn from its previous northward trajectory over the Atlantic Ocean and headed for the New Jersey coast. On the evening of October 29, following a track never before seen in one hundred sixty years of Atlantic hurricane observations, the center of the storm made landfall near Atlantic City. The destruction sprawled far from there.
A few days earlier, over the Bahamas, Sandy had crossed paths with another weather disturbance, a low-pressure system in the upper atmosphere. It took on some of that systems properties, including its great size. As it made landfall, it merged with yet another system, an extratropical, or winter, storm that had come from the North American continent at the leading edge of a blast of autumn cold air. This merger gave Sandy a new jolt of energy, increased its size yet further, and completed its transition from a tropical cyclone to a mammoth hybrid. When reporters saw this coming in the weather forecasts, they dubbed it, glibly at first, Frankenstorm. But as its gravity soon defied humor, it was renamed Superstorm Sandy.
The size of the storm, like the track, was unprecedented in scientific memory. Sandy was the largest hurricane ever observed in the several decades since good measurements of hurricane size have existed in the Atlantic. At its landfall, gale-force winds covered a large fraction of the Eastern Seaboard and an enormous patch of oceanic real estate as well. To the north of the center, Sandys easterlies traversed a thousand-mile-plus fetch before coming onshore, driving a massive storm surge: a giant, slow wave that dragged the ocean inland, on top of the high tide, and onto some of the most heavily populated, economically active, and valuable land on earth.
The scale of the disaster was historic. In New York City, the water had not come this high since at least 1821, if then. For people in the hardest-hit areas, it was a life-crushing eventin some cases, literally. While the death toll was low compared to Hurricane Katrinas, and extremely low compared to those of the worst tropical cyclone disasters in recent history worldwide, it was high enough to be grievously shocking here in New York City, where losing ones life to a hurricane is thought of as something that happens only in faraway places. Many, many people saw their homes destroyed, and in some cases entire neighborhoods. The storm crippled the infrastructure of one of the worlds most vibrant economic and cultural centers for a period of weeks. The economic damage has been counted at fifty billion dollars at least, and perhaps as high as sixty-five billion.
Was Sandy a freak of nature or a sign of disasters to come? Where did it come from, and what were the atmospheric forces that made it happen? How did we manage to live for so long in such a vulnerable state, knowing as we did that storms like this were possible? Now that we know, not just theoretically but also from hard experience, that such storms can happen here in New York City (and in other coastal cities that have never had weather disasters of this magnitude, but well could), what should we do to prepare for the future? This book is an attempt to answer these questions by telling the story of the storm, and putting it in both scientific and historical context.

