Jeff Augen - Microsoft Excel for Stock and Option Traders: Build Your Own Analytical Tools for Higher Returns
Here you can read online Jeff Augen - Microsoft Excel for Stock and Option Traders: Build Your Own Analytical Tools for Higher Returns full text of the book (entire story) in english for free. Download pdf and epub, get meaning, cover and reviews about this ebook. year: 2011, publisher: Cisco Press, genre: Business. Description of the work, (preface) as well as reviews are available. Best literature library LitArk.com created for fans of good reading and offers a wide selection of genres:
Romance novel
Science fiction
Adventure
Detective
Science
History
Home and family
Prose
Art
Politics
Computer
Non-fiction
Religion
Business
Children
Humor
Choose a favorite category and find really read worthwhile books. Enjoy immersion in the world of imagination, feel the emotions of the characters or learn something new for yourself, make an fascinating discovery.

- Book:Microsoft Excel for Stock and Option Traders: Build Your Own Analytical Tools for Higher Returns
- Author:
- Publisher:Cisco Press
- Genre:
- Year:2011
- Rating:3 / 5
- Favourites:Add to favourites
- Your mark:
Microsoft Excel for Stock and Option Traders: Build Your Own Analytical Tools for Higher Returns: summary, description and annotation
We offer to read an annotation, description, summary or preface (depends on what the author of the book "Microsoft Excel for Stock and Option Traders: Build Your Own Analytical Tools for Higher Returns" wrote himself). If you haven't found the necessary information about the book — write in the comments, we will try to find it.
Jeff Augen: author's other books
Who wrote Microsoft Excel for Stock and Option Traders: Build Your Own Analytical Tools for Higher Returns? Find out the surname, the name of the author of the book and a list of all author's works by series.
Microsoft Excel for Stock and Option Traders: Build Your Own Analytical Tools for Higher Returns — read online for free the complete book (whole text) full work
Below is the text of the book, divided by pages. System saving the place of the last page read, allows you to conveniently read the book "Microsoft Excel for Stock and Option Traders: Build Your Own Analytical Tools for Higher Returns" online for free, without having to search again every time where you left off. Put a bookmark, and you can go to the page where you finished reading at any time.
Font size:
Interval:
Bookmark:
Build Your Own Analytical Tools for Higher Returns
Jeff Augen
Vice President, Publisher: Tim Moore
Associate Publisher and Director of Marketing: Amy Neidlinger
Executive Editor: Jim Boyd
Editorial Assistant: Pamela Boland
Operations Manager: Gina Kanouse
Senior Marketing Manager: Julie Phifer
Publicity Manager: Laura Czaja
Assistant Marketing Manager: Megan Colvin
Cover Designer: Chuti Prasertsith
Managing Editor: Kristy Hart
Project Editor: Betsy Harris
Copy Editor: Cheri Clark
Proofreader: Kathy Ruiz
Indexer: Erika Millen
Senior Compositor: Gloria Schurick
Manufacturing Buyer: Dan Uhrig
2011 by Pearson Education, Inc.
Publishing as FT Press
Upper Saddle River, New Jersey 07458
This book is sold with the understanding that neither the author nor the publisher is engaged in rendering legal, accounting, or other professional services or advice by publishing this book. Each individual situation is unique. Thus, if legal or financial advice or other expert assistance is required in a specific situation, the services of a competent professional should be sought to ensure that the situation has been evaluated carefully and appropriately. The author and the publisher disclaim any liability, loss, or risk resulting directly or indirectly, from the use or application of any of the contents of this book.
FT Press offers excellent discounts on this book when ordered in quantity for bulk purchases or special sales. For more information, please contact U.S. Corporate and Government Sales, 1-800-382-3419, .
Company and product names mentioned herein are the trademarks or registered trademarks of their respective owners.
All rights reserved. No part of this book may be reproduced, in any form or by any means, without permission in writing from the publisher.
Printed in the United States of America
First Printing April 2011
ISBN-10: 0-13-713182-8
ISBN-13: 978-0-13-713182-2
Pearson Education LTD.
Pearson Education Australia PTY, Limited.
Pearson Education Singapore, Pte. Ltd.
Pearson Education North Asia, Ltd.
Pearson Education Canada, Ltd.
Pearson Educacin de Mexico, S.A. de C.V.
Pearson EducationJapan
Pearson Education Malaysia, Pte. Ltd.
Library of Congress Cataloging-in-Publication Data
Augen, Jeffrey.
Microsoft Excel for stock and option traders : build your own analytical tools for
higher returns / Jeffrey Augen.
p. cm.
ISBN 978-0-13-713182-2 (hbk. : alk. paper)
1. Investment analysisComputer programs. 2. Investment analysisMathematical
models. 3. Microsoft Excel (Computer file) I. Title.
HG4515.5.A94 2011
332.640285554dc22
2011003034
To Lisa, who changed everything when she said:
Why dont you just calculate the integral between
those two points and chart the value as
it changes over time?
I would like to thank the team that helped pull the book together. First must be Jim Boyd, who encouraged me to continue the project and always seems willing to explore new areas and concepts. This book would never have made it to print without advice and direction from Jim. Once again it was my pleasure to work with Betsy Harris, who always does a terrific job turning a rough manuscript into a polished, production-quality book. In that regard, I must also thank Cheri Clark, who carefully read every word and made corrections that put the finishing touch on the work. Finally, Id like to acknowledge the important contributions of a friendRobert Birnbaum. Over the past several months, Robert has helped shape my thinking about the statistical relevance of trendsideas which surfaced in some of the key examples and continue to weigh heavily in my own investing.
Jeff Augen, currently a private investor and writer, has spent more than a decade building a unique intellectual property portfolio of databases, algorithms, and associated software for technical analysis of derivatives prices. His work, which includes more than a million lines of computer code, is particularly focused on the identification of subtle anomalies and price distortions.
Augen has a 25-year history in information technology. As cofounding executive of IBMs Life Sciences Computing business, he defined a growth strategy that resulted in $1.2 billion of new revenue and managed a large portfolio of venture capital investments. From 2002 to 2005, Augen was President and CEO of TurboWorx Inc., a technical computing software company founded by the chairman of the Department of Computer Science at Yale University. His books include Trading Realities, Day Trading Options, Trading Options at Expiration, The Option Traders Workbook, and The Volatility Edge in Options Trading. He currently teaches option trading classes at the New York Institute of Finance and writes a weekly column for Stocks, Futures and Options magazine.
In August 2010, Cisco stock (ticker: CSCO) hovered just a few cents below $25. Several analysts identified the stock as a strong buy. They pointed to the rising demand for network infrastructure that, among other things, was being driven by explosive growth in online video gaming and Internet television. Cisco, they believed, would continue to dominate the consumer market while benefiting from a weak dollar and low manufacturing costs. They must have been wrong because the stock fell 15% when earnings were released on August 11. The price continued to decline until August 31, when it bottomed out at $1924% below its previous high. About the time that everyone had given up and turned bearish, the stock began to rally. On November 10 the price was, once again, back up to $24.50. Then came another earnings report and another sharp decline. The price immediately fell 16% and continued plunging until, on December 3, it once again bottomed out at $19. These bizarre dynamics played out a third time, with the stock rallying steadily to $22 on February 9, 2011, before falling back to $18.92 the very displays Cisco closing prices from June 1, 2010, to February 11, 2011.
Figure P.1 CSCO closing prices June 1, 2010 to February 11, 2011.
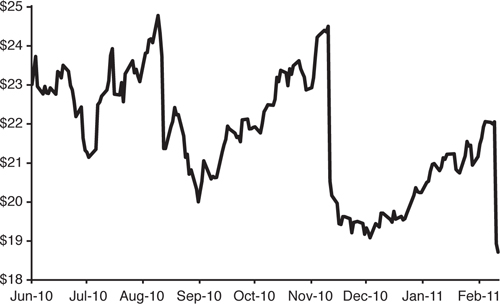
Wild unpredictability doesnt seem to discourage speculators because the trading volume for Cisco remains shockingly high. Moreover, the number of investors who bet on the direction of the stock seems to peak just before and after earningsthe most dangerous times of all. For example, the trading volume climbed above 125 million shares on February 9, 2011 (before earnings), and skyrocketed to 560 million shares the next day after the numbers were released. Each of the previously outlined events was accompanied by a similar pattern of extremely high volume the day before earnings were announced and even higher volume the day after.
Who would trade this completely unpredictable stock? Why does the volume soar at the most dangerous times when anything seems possible? More importantly, why do analysts believe that they know enough to make predictions? The answers are simple. Analysts can make all the predictions they want because its not their money that ends up being lost, and speculators always believe they can find a bargain. As a group, investors tend to be arrogant. They typically believe that they have unique insights and that these insights give them an advantage over the market. One of the most common mistakes is relying on traditional off-the-shelf technical indicators that often prove to be even less reliable than fundamental analysis. The Cisco story represents one of the best examples of the problem.
Font size:
Interval:
Bookmark:
Similar books «Microsoft Excel for Stock and Option Traders: Build Your Own Analytical Tools for Higher Returns»
Look at similar books to Microsoft Excel for Stock and Option Traders: Build Your Own Analytical Tools for Higher Returns. We have selected literature similar in name and meaning in the hope of providing readers with more options to find new, interesting, not yet read works.
Discussion, reviews of the book Microsoft Excel for Stock and Option Traders: Build Your Own Analytical Tools for Higher Returns and just readers' own opinions. Leave your comments, write what you think about the work, its meaning or the main characters. Specify what exactly you liked and what you didn't like, and why you think so.