Index
[]
Index
[]appraising data needsvector data
Index
[]base maps
Index
[]Chameleoncommand-line toolsogr2ogr
Index
[]dataformat typesformatsdatabases
Index
[]EPSG
Index
[]FGS
Index
[]gdalinfo commandGDAL/OGR (continued)geographic dataGIStoolsGPSGTOPO
Index
[]
Index
[]
Index
[]
Index
[]
Index
[]labelslegendembeddedlongitudes
Index
[]map datamap examplesmap filemap file examplesmaps
Index
[]
Index
[]observationsexamplesopen sourceGeneral tabmap file examples
Index
[]PNGPostGIS (continued)Proj.4project tasksprojections
Index
[]
Index
[]raster datareference map
Index
[]scale barspatial queryingSRTM
Index
[]3D view
Index
[]
Index
[]Unix commandsUSGS DEMUTM (Universal Transverse Mercator)
Index
[]vector dataaccess
Index
[]web services
Index
[]
Index
[]
 | | Web Mapping Illustrated | | By Tyler Mitchell | | ............................................... | | Publisher: O'Reilly | | Pub Date: June 2005 | | ISBN: 0-596-00865-1 | | Pages: |
|
 |
With the help of the Internet and accompanying tools,creating and publishing online maps has become easier andrich with options. A city guide web site can use maps toshow the location of restaurants, museums, and art venues. Abusiness can post a map for reaching its offices. The stategovernment can present a map showing average income byarea.
Developers who want to publish maps on the web oftendiscover that commercial tools cost too much and huntingdown the free tools scattered across Internet can use up toomuch of your time and resources. Web MappingIllustrated shows you how to create maps, eveninteractive maps, with free tools, including MapServer,OpenEV, GDAL/OGR, and PostGIS. It also explains how tofind, collect, understand, use, and share mapping data, bothover the traditional Web and using OGC-standard serviceslike WFS and WMS.
Mapping is a growing field that goes beyond collecting andanalyzing GIS data. Web MappingIllustrated shows how to combine free geographicdata, GPS, and data management tools into one resource foryour mapping information needs so you don't have to loseyour way while searching for it.
Remember the fun you had exploring the world with maps?Experience the fun again with Web MappingIllustrated . This book will take you on a directroute to creating valuable maps. |
A.1. The Third Spheroid from the Sun
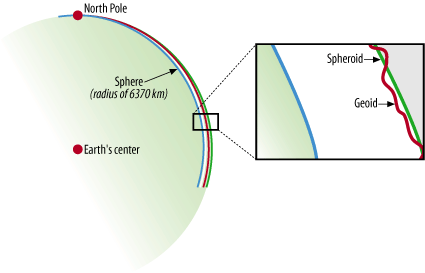
The Earth is round, or so they say. Video games, globes, and graphic art may depict the Earth as a perfect ball shape or sphere , but in reality the Earth is a bit squished. Therefore, we call the Earth a spheroid , rather than a sphere. It is sphere-like, but somewhat elliptical.
To take it one level further, we all know that the surface of the Earth isn't perfectly uniform. There are mountains and valleys, bumps and dips. Geoid is the term used for a more detailed model of the Earth's shape. At any point on the globe, the geoid shows an example of the relationships among the sphere, spheroid, and geoid.
.
As you can see, when talking about the shape of the Earth it is very important to know what shape you are referring to. The shape of the Earth is a critical factor when
Figure A-1. Illustration of methods for describing the Earth's shape
producing maps because you (usually) want to refer to the most exact position possible. Many maps are intended for some sort of navigational purpose, therefore mapmakers need a consistent way of helping viewers find a location.
A.1.1. Geographic Coordinate System
How do you refer someone to a particular location on the Earth? You might say a city name, or give a reference to a landmark such as a mountain. This subjective way of referring to a location is helpful only if you already have an idea of where nearby locations are. Driving directions are a good example of a subjective description for navigating to a particular location. You may get directions like "Take the highway north, turn right onto Johnson Road and go for about 20 miles to get to the farm." Depending on where you start from, this may help you get to the farm, or it may not. There has to be a better way to tell someone where to go and how to get there. There is a better way; it is called the Geographic Coordinate System.
The increasing use of hand-held Global Positioning Systemreceivers is helping the general public think about the Geographic Coordinate System. People who own a GPS receiver can get navigation directions to a particular location using a simple pair of numbers called coordinates . Sometimes an elevation can be provided too, giving a precise 3D description of a location.
A Geographic Coordinate System, like that shown in , is based on a method of describing locations using a longitude and latitude degree measurement. These describe a specific distance from the equator (0 north/south) and the Greenwich Meridian (0 east/west).
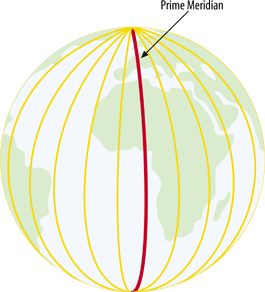
From this starting point, the earth is split into 360 slices, running from the North Pole to the South Pole, known as degrees and represented by the symbol . Half of
Figure A-2. A Geographic Coordinate System
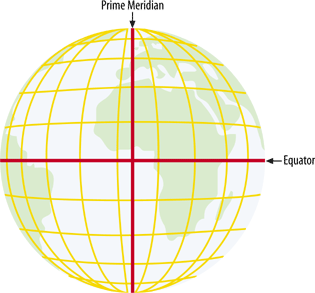
these slices are to the east of 0 and half are to the west. These are referred to as longitudes or meridians ).
Figure A-3. Longitudes, divided into hemispheres of 180 each
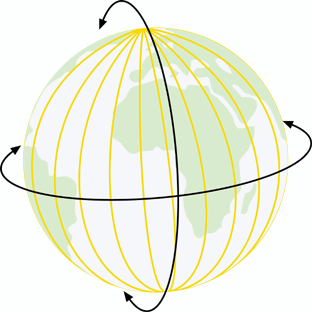
A variant of the basic geographic coordinate system for longitudes is useful in some parts of the world. For example, 180 west longitude runs right through the South Pacific Islands. Maps of this area can use a system where longitudes start at 0 and increase eastward only, ending back at the same location which is also known as 360 (see ).
Figure A-4. Longitudes, running from 0 to 360
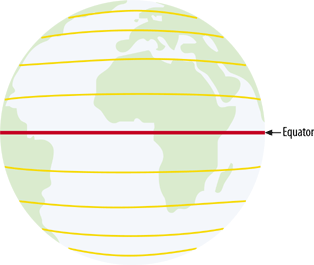
The earth is divided into latitudes as well. You can picture these as 180 slices running horizontally around the globe. Half of these slices are north of the equator and the other half are south of the equator. These are referred to as latitudes or parallels. Therefore the values range from 90 south latitude (at the south pole) to 90 north latitude (at the north pole) (see ).
Figure A-5. Latitudes, from the equator to 90
