• Complain

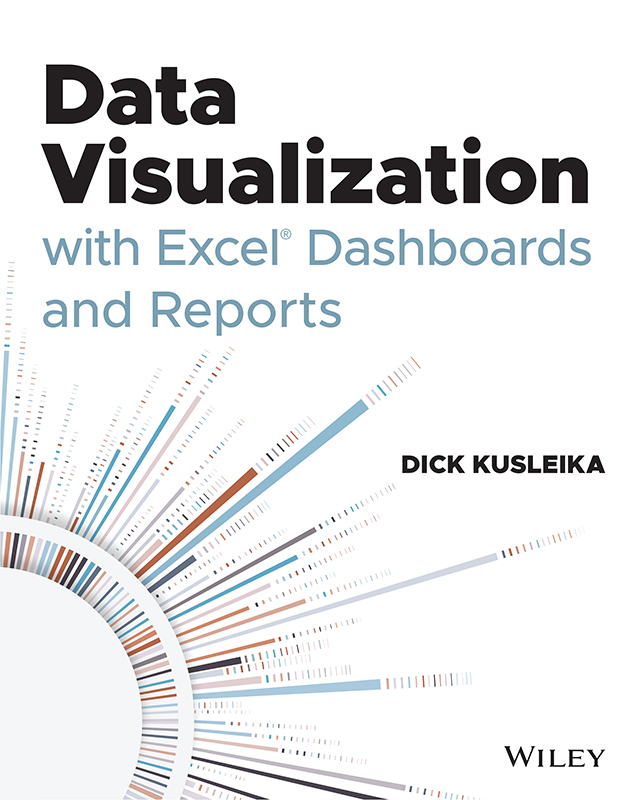
Dick Kusleika - Data Visualization with Excel Dashboards and Reports

Here you can read online Dick Kusleika - Data Visualization with Excel Dashboards and Reports full text of the book (entire story) in english for free. Download pdf and epub, get meaning, cover and reviews about this ebook. City: Hoboken, year: 2021, publisher: Wiley, genre: Computer. Description of the work, (preface) as well as reviews are available. Best literature library LitArk.com created for fans of good reading and offers a wide selection of genres:

Romance novel Science fiction Adventure Detective Science History Home and family Prose Art Politics Computer Non-fiction Religion Business Children Humor

Choose a favorite category and find really read worthwhile books. Enjoy immersion in the world of imagination, feel the emotions of the characters or learn something new for yourself, make an fascinating discovery.

No cover
  • Book:
    Data Visualization with Excel Dashboards and Reports
  • Author:
  • Publisher:
    Wiley
  • Genre:
  • Year:
    2021
  • City:
    Hoboken
  • Rating:
    3 / 5
  • Favourites:
    Add to favourites
  • Your mark:
    • 60
    • 1
    • 2
    • 3
    • 4
    • 5

Data Visualization with Excel Dashboards and Reports: summary, description and annotation

We offer to read an annotation, description, summary or preface (depends on what the author of the book "Data Visualization with Excel Dashboards and Reports" wrote himself). If you haven't found the necessary information about the book — write in the comments, we will try to find it.

Large corporations like IBM and Oracle are using Excel dashboards and reports as a Business Intelligence tool, and many other smaller businesses are looking to these tools in order to cut costs for budgetary reasons. An effective analyst not only has to have the technical skills to use Excel in a productive manner but must be able to synthesize data into a story, and then present that story in the most impactful way. Microsoft shows its recognition of this with Excel. In Excel, there is a major focus on business intelligence and visualization. Data Visualization with Excel Dashboards and Reports fills the gap between handling data and synthesizing data into meaningful reports. This title will show readers how to think about their data in ways other than columns and rows.

Most Excel books do a nice job discussing the individual functions and tools that can be used to create an Excel Report. Titles on Excel charts, Excel pivot tables, and other books that focus on Tips and Tricks are useful in their own right; however they dont hit the mark for most data analysts. The primary reason these titles miss the mark is they are too focused on the mechanical aspects of building a chart, creating a pivot table, or other functionality. They dont offer these topics in the broader picture by showing how to present and report data in the most effective way.

What are the most meaningful ways to show trending? How do you show relationships in data? When is showing variances more valuable than showing actual data values? How do you deal with outliers? How do you bucket data in the most meaningful way? How do you show impossible amounts of data without inundating your audience? In Data Visualization with Excel Reports and Dashboards, readers will get answers to all of these questions. Part technical manual, part analytical guidebook; this title will help Excel users go from reporting data with simple tables full of dull numbers, to creating hi-impact reports and dashboards that will wow management both visually and substantively. This book offers a comprehensive review of a wide array of technical and analytical concepts that will help users create meaningful reports and dashboards.

After reading this book, the reader will be able to:

  • Analyze large amounts of data and report their data in a meaningful way
  • Get better visibility into data from different perspectives
  • Quickly slice data into various views on the fly
  • Automate redundant reporting and analyses
  • Create impressive dashboards and What-If analyses
  • Understand the fundamentals of effective visualization
  • Visualize performance comparisons
  • Visualize changes and trends over time

Dick Kusleika: author's other books


Who wrote Data Visualization with Excel Dashboards and Reports? Find out the surname, the name of the author of the book and a list of all author's works by series.

Data Visualization with Excel Dashboards and Reports — read online for free the complete book (whole text) full work

Below is the text of the book, divided by pages. System saving the place of the last page read, allows you to conveniently read the book "Data Visualization with Excel Dashboards and Reports" online for free, without having to search again every time where you left off. Put a bookmark, and you can go to the page where you finished reading at any time.

Light

Font size:

Reset

Interval:

Bookmark:

Make
Table of Contents List of Tables Chapter 1 Chapter 2 Chapter 5 List of - photo 1
Table of Contents
List of Tables
  1. Chapter 1
  2. Chapter 2
  3. Chapter 5
List of Illustrations
  1. Chapter 1
  2. Chapter 2
  3. Chapter 3
  4. Chapter 4
  5. Chapter 5
  6. Chapter 6
  7. Chapter 7
  8. Chapter 8
  9. Chapter 9
Guide
Pages
Data Visualization with Excel Dashboards and Reports

Dick Kusleika

Data Visualization with Excel Dashboards and Reports Copyright 2021 by John - photo 2

Data Visualization with Excel Dashboards and Reports

Copyright 2021 by John Wiley & Sons, Inc., Indianapolis, Indiana

Published simultaneously in Canada

ISBN: 978-1-119-69872-2
ISBN: 978-1-119-69880-7 (ebk)
ISBN: 978-1-119-69873-9 (ebk)

Manufactured in the United States of America

No part of this publication may be reproduced, stored in a retrieval system or transmitted in any form or by any means, electronic, mechanical, photocopying, recording, scanning or otherwise, except as permitted under Sections 107 or 108 of the 1976 United States Copyright Act, without either the prior written permission of the Publisher, or authorization through payment of the appropriate per-copy fee to the Copyright Clearance Center, 222 Rosewood Drive, Danvers, MA 01923, (978) 750-8400, fax (978) 646-8600. Requests to the Publisher for permission should be addressed to the Permissions Department, John Wiley & Sons, Inc., 111 River Street, Hoboken, NJ 07030, (201) 748-6011, fax (201) 748-6008, or online at www.wiley.com/go/permissions.

Limit of Liability/Disclaimer of Warranty:The publisher and the author make no representations or warranties with respect to the accuracy or completeness of the contents of this work and specifically disclaim all warranties, including without limitation warranties of fitness for a particular purpose. No warranty may be created or extended by sales or promotional materials. The advice and strategies contained herein may not be suitable for every situation. This work is sold with the understanding that the publisher is not engaged in rendering legal, accounting, or other professional services. If professional assistance is required, the services of a competent professional person should be sought. Neither the publisher nor the author shall be liable for damages arising herefrom. The fact that an organization or Web site is referred to in this work as a citation and/or a potential source of further information does not mean that the author or the publisher endorses the information the organization or website may provide or recommendations it may make. Further, readers should be aware that Internet websites listed in this work may have changed or disappeared between when this work was written and when it is read.

For general information on our other products and services please contact our Customer Care Department within the United States at (877) 762-2974, outside the United States at (317) 572-3993 or fax (317) 572-4002.

Wiley publishes in a variety of print and electronic formats and by print-on-demand. Some material included with standard print versions of this book may not be included in e-books or in print-on-demand. If this book refers to media such as a CD or DVD that is not included in the version you purchased, you may download this material at booksupport.wiley.com. For more information about Wiley products, visit www.wiley.com.

Library of Congress Control Number:2020951591

Trademarks:Wiley and the Wiley logo are trademarks or registered trademarks of John Wiley & Sons, Inc. and/or its affiliates, in the United States and other countries, and may not be used without written permission. Excel is a registered trademark of Microsoft Corporation. All other trademarks are the property of their respective owners. John Wiley & Sons, Inc. is not associated with any product or vendor mentioned in this book.

to Butters

About the Author

Dick Kusleikahas been working with Microsoft Office for more than 20 years.

Next page
Light

Font size:

Reset

Interval:

Bookmark:

Make

Similar books «Data Visualization with Excel Dashboards and Reports»

Look at similar books to Data Visualization with Excel Dashboards and Reports. We have selected literature similar in name and meaning in the hope of providing readers with more options to find new, interesting, not yet read works.


Reviews about «Data Visualization with Excel Dashboards and Reports»

Discussion, reviews of the book Data Visualization with Excel Dashboards and Reports and just readers' own opinions. Leave your comments, write what you think about the work, its meaning or the main characters. Specify what exactly you liked and what you didn't like, and why you think so.