• Complain

William K. Wonder - CREATE DYNAMIC EXCEL DASHBOARDS: A simplified step-by-step guide

Here you can read online William K. Wonder - CREATE DYNAMIC EXCEL DASHBOARDS: A simplified step-by-step guide full text of the book (entire story) in english for free. Download pdf and epub, get meaning, cover and reviews about this ebook. year: 2017, genre: Home and family. Description of the work, (preface) as well as reviews are available. Best literature library LitArk.com created for fans of good reading and offers a wide selection of genres:

Romance novel Science fiction Adventure Detective Science History Home and family Prose Art Politics Computer Non-fiction Religion Business Children Humor

Choose a favorite category and find really read worthwhile books. Enjoy immersion in the world of imagination, feel the emotions of the characters or learn something new for yourself, make an fascinating discovery.

No cover
  • Book:
    CREATE DYNAMIC EXCEL DASHBOARDS: A simplified step-by-step guide
  • Author:
  • Genre:
  • Year:
    2017
  • Rating:
    5 / 5
  • Favourites:
    Add to favourites
  • Your mark:
    • 100
    • 1
    • 2
    • 3
    • 4
    • 5

CREATE DYNAMIC EXCEL DASHBOARDS: A simplified step-by-step guide: summary, description and annotation

We offer to read an annotation, description, summary or preface (depends on what the author of the book "CREATE DYNAMIC EXCEL DASHBOARDS: A simplified step-by-step guide" wrote himself). If you haven't found the necessary information about the book — write in the comments, we will try to find it.

This book is born out of helping a lot of my clients to develop interactive Excel reports from their usual dull tables that are normally ignored by management while making decisions. It is therefore written with the pains of a working profession in mind.
In it, I have connected the dots on how to leverage on Excel formulas and features to create an interactive Excel dashboard. The end goal is to set up a dashboard that will only require pasting of new data to refresh the various KPIs being tracked, without having to rework the analysis behind these metrics!
You will thus find it useful if you are looking forward to significantly cut down on the time taken not only to create reports, but time taken during management meetings as managers ask for various views of your data.
As an analyst, you will then be able to focus on what really matters to you and the business -i.e. drawing insights from data and advising management decisions.
It covers:
1.How to prep your data for further reporting. That includes cleaning and adding auxiliary columns.
2.Data analysis techniques available in Excel with a special focus on hidden PivotTable features such as displaying %, showing YoY growth rates, connecting a slicer to multiple reports and making these slicers static on the dashboard page, among others.
3.Features to make the Excel dashboard dynamic and interactive
4.Protecting and sharing the dashboard file, including a macro to print the dashboard view.

William K. Wonder: author's other books


Who wrote CREATE DYNAMIC EXCEL DASHBOARDS: A simplified step-by-step guide? Find out the surname, the name of the author of the book and a list of all author's works by series.

CREATE DYNAMIC EXCEL DASHBOARDS: A simplified step-by-step guide — read online for free the complete book (whole text) full work

Below is the text of the book, divided by pages. System saving the place of the last page read, allows you to conveniently read the book "CREATE DYNAMIC EXCEL DASHBOARDS: A simplified step-by-step guide" online for free, without having to search again every time where you left off. Put a bookmark, and you can go to the page where you finished reading at any time.

Light

Font size:

Reset

Interval:

Bookmark:

Make

CREATE DYNAMIC EXCELDASHBOARDS

A simplified step-by-stepguide

William K. Wonder


Copyright

All Rights Reserved

2017 William K. Wonder

This book is licensed strictly forpersonal or educational use.

Redistributionin any form is prohibited, and should only happen with express writtenauthorization from the publisher/author.

Everyeffort has been made to make this eBook as complete and accurate as possible.However, the authors and copyright holders provide absolutely no warranty forany information provided, and shall not be liable to any person or entity forany claim, damages, or any other liability arising from, out of, or inconnection with the information in this book.

This document and sample workbook areprovided as-is and expresses the authors views and opinions. Information andviews expressed in this document and sample workbook, including URL and otherInternet Web site references, may change without notice.


Content

About this book

This book aims at equippingyou with advanced Pivot Table skills that can help you analyze any set of dataand present it in an intuitive and interactive style as opposed to presenting staticreports. I will focus on the hidden power of Pivot Tables as I take you througha journey of creating your interactive data visualizations.

The techniques covered herewill apply for MS Excel 2010 and higher versions.

As much as this dashboarduses sales transactions data, the techniques discussed here-in will apply forany other data, so long as the data is arranged and defined by the conventionalrows and columns!

This book takes a very practicalapproach to data analysis in Excel and my high anticipation is that youwill find it easy to follow the useful techniques that you need to provideinsights backed by data. I look forward to interacting with you at my blog datacycleanalytics.com /blog oron Twitter @BillWilliamsK , LinkedIn and Facebook .

As a supplement to thismanuscript, I recommend articles at Chandoos website who in many ways has been a mentor in my learning journey of advancedExcel concepts.

The content covered hereinseeks to consolidate in a centralized place my experience in training various workingprofessionals in Kenya on how to maximize advanced Excel features in the office.

Should you need to clarifysomething as you go through the content herein, please write to me on

Iencourage you to practice the concepts by using the accompanying Excel workbook sothat you can gain maximum benefits.

I will appreciate if youcould also leave an honest review on Amazon.

Complement your experiencewith this

FREEDOWNLOAD

Greatdashboards are a product of well thought out charts Grab your free copyof - photo 1

Greatdashboards are a product of well thought out charts. Grab your free copyof the Boardroom Ready Chart Book and learn how to communicate yourmessage to inspire action!

Clickhere to get your copy

https://datacycleanalytics.com/boardroom-ready-excel-charts/

Introduction

Business Intelligence isone of the buzzwords in this age of big data, data science, and analytics. Tosimplify the understanding of Business Intelligence (BI) we shall limitourselves to the ability to leverage on data to inform business decisions.In order for management to have fruitful discussions during their periodicalmeetings, the analysts need to learn the invaluable skill of dashboardreporting.

A dashboard can be taken asa decision support tool that succinctly displays the key metrics being tracked,mostly on a single screen. Most BI solutions provide ability to developdashboards. MS Excel provides a very flexible platform to develop veryinteractive dashboards without having to make extra investments.

A DASHBOARD is a decision support tool that succinctly displaysthe key metrics, mostly on a single screen, for better management decisions.

When creating dashboards inany platform, it is important to think through the messageonewants to convey. Each chart type and table that one includes in thedashboard page need to complement and add a different angle to the overridingtheme of the dashboard.

The choice of colouris very important. I recommend using colours that are easy on the eye. To besafe, stick to your corporate colours. After all, the goal of the dashboardis insights and not pictures!

Another consideration forcreating a dashboard is the need to clearly communicate information at alevel that is actionable. For instance, a CFO and a product manager mayrequire to track information at different levels of details. As an analyst, youneed to listen to the needs of various users of the dashboards and distill itto the right level. This calls for discussions with the consumer of yourdashboard to understand how the information displayed impacts their day-to-daydecisions.

This book doesnt go intodetails in regard to the above paragraphs but assumes the reader has taken careof these considerations.

CHAPTER 1: PLANNING THE DASHBOARD
Case Study: Santa Inn Restaurant

Therest of this book shall focus on a fictitious restaurant, Santa Inn, whichoperates in 4 locations. The structure of the business is such that each of thelocations has several sales agents.

CLICKHERE TO DOWNLOAD THE COMPANION WORKBOOK

Santa Inn has employed Jeanas a Data Insights Analyst and its management, in particular the hotel manager,needs a way to have a better grip on the core business numbers for him tobetter react to market trends.

After interviewing thehotel manager, Jean came up with the following as the most important metricsthat will show the health of the business.

Totalrevenue (YTD) generated in a given year, and the growth rates there of

Monthlytrend analysis of revenue for the past 3 years

Contributionof each location to the overall revenue

Best-selling(top 5) and poorly performing (bottom 5) products in each location for agiven year

Performanceof the various product categories to see the category driving sales, again slicedper location and year

Performanceby sales agents

Having worked with SantaInn since its inception, Jean knows her way into the business and goes ahead toimport the data that would help her address the needs raised by the hotelmanager.

Figure Sample data set On quick scan of the datashe got from the system - photo 2

Figure :Sample data set

On quick scan of the datashe got from the system, Jean identifies that the business deals with 77unique products that are segmented into 8 categories. The datarepresents 3 years of sales. She is happy and gets down to business.

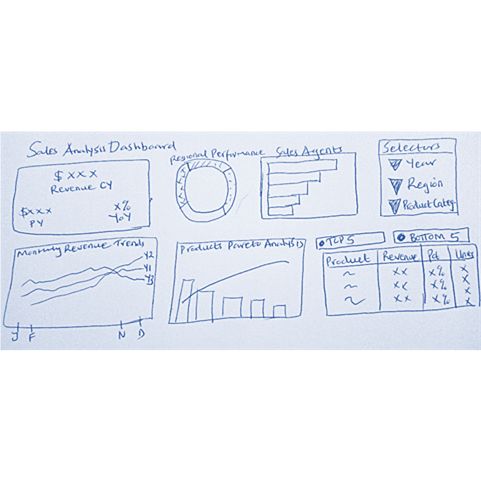
Before she goes further, Jeantakes a pen and a paper and mocks up how her final dashboard would look like.Figure 2 below shows the sketch that will act asthe road map for the rest of this book.

Figure Dashboard Sketch Mockup DashboardTip It is good practice to - photo 3

Figure :Dashboard Sketch / Mockup

DashboardTip:

It is good practice to always draft a mockup of the finaloutput. The mock up follows the user requirements gathered during theinterviews with the hotel manager above. Sketching allows you to think what isthe best visualization to use to convey each of the metrics identified, and therelative positioning of the visuals on the one pager dashboard. This also savesyou a lot of time when it comes to doing the analysis. Note however, that thesketch/design acts as a guideline and you can review it until you achieve onethat will use the one-worksheet optimally.

Next page
Light

Font size:

Reset

Interval:

Bookmark:

Make

Similar books «CREATE DYNAMIC EXCEL DASHBOARDS: A simplified step-by-step guide»

Look at similar books to CREATE DYNAMIC EXCEL DASHBOARDS: A simplified step-by-step guide. We have selected literature similar in name and meaning in the hope of providing readers with more options to find new, interesting, not yet read works.


Reviews about «CREATE DYNAMIC EXCEL DASHBOARDS: A simplified step-by-step guide»

Discussion, reviews of the book CREATE DYNAMIC EXCEL DASHBOARDS: A simplified step-by-step guide and just readers' own opinions. Leave your comments, write what you think about the work, its meaning or the main characters. Specify what exactly you liked and what you didn't like, and why you think so.