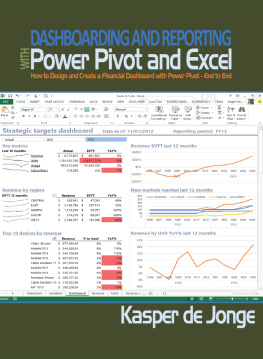
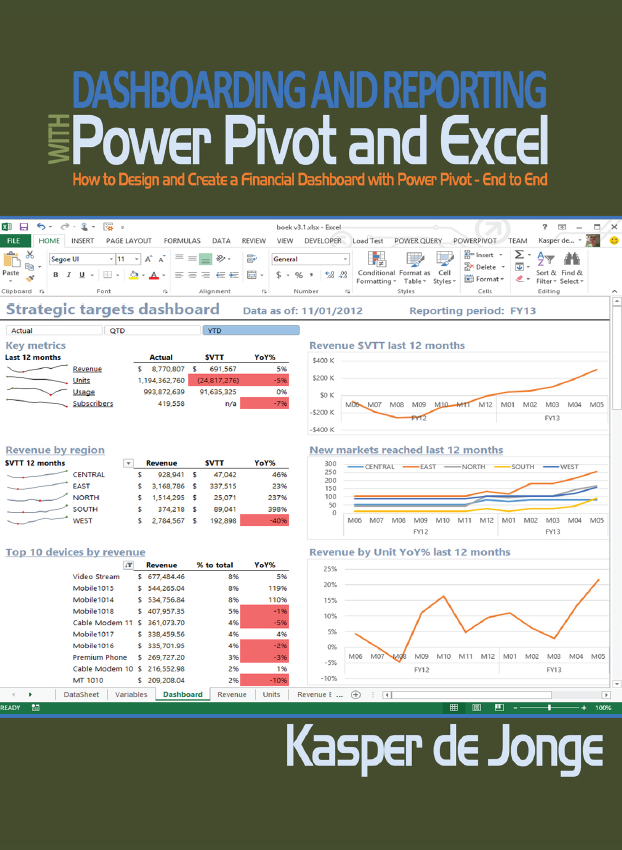
Dashboarding and Reporting with
Power Pivot and Excel
by
Kasper de Jonge
Holy Macro! Books
PO Box 82, Uniontown, OH 44685 USA
Dashboarding and Reporting with Power Pivot and Excel
2014 Kasper de Jonge
All rights reserved. No part of this book may be reproduced or transmitted in any form or by any means, electronic or mechanical, including photocopying, recording, or by any information or storage retrieval system without permission from the publisher. Every effort has been made to make this book as complete and accurate as possible, but no warranty or fitness is implied. The information is provided on an as is basis. The authors and the publisher shall have neither liability nor responsibility to any person or entity with respect to any loss or damages arising from the information contained in this book.
Author: Kasper de Jonge
Layout: Tyler Nash
Cover Design: Jocelyn Collie
Indexing: Nellie J. Liwam
Published by: Holy Macro! Books, PO Box 82, Uniontown, OH 44685 USA
Distributed by: Independent Publishers Group, Chicago, IL
First Printing: March 2014. Printed in USA
Print 978-1-61547-027-3, Mobi 978-1-61547-118-8, PDF 978-1-61547-218-5, ePub 978-1-61547-339-7
Contents
Acknowledgmentsv
Prefacevii
1- About This Book1
2- Introduction to Dashboards and Reports7
3- Collecting and Preparing the Data11
4- Building a Dashboard in Excel45
5- Building Interactive Reports with Excel and Power View99
6- Sharing Dashboards and Reports Within an Organization141
Bibliography and Suggested Readings175
Index of Tips.........................................................................................................................................177
Index179
Acknowledgments
Many people contributed to this book in both small and big ways, its nearly impossible to write a complete list. Many users of Power Pivot both inside and outside of Microsoft, bloggers, tweeps, conference attendees were my inspiration to finally start writing a book after almost 5 years of blogging. There already are some great books on Power Pivot out there but I think a real hands on and practical book on Power Pivot was needed.
Of course there are some people that I need to call out to as without their help this book or journey would never has started. I have to thank Rob Collie for those nights trying to understand DAX during the Project Gemini timeframe and urging me to go work for the Analysis Services team and change my life. John Hancock for believing in me and to teach me to never be afraid to think different and Julie Strauss for teaching me to challenge things and keep true to my gut feeling.
During the course of this book I have had the help of several folks inside Microsoft: Jay Thacker, Hassan Murad and Lance Delano for giving me that finance and business insight and giving honest feedback. The true masters of DAX: Howie Dickerman, Srinivasan Turuvekere, Jeffrey Wang and Marius Dumitru that helped me out when the DAX became too magical and clarity was needed (and check my formulas :) ). Amy, Russell and Drew to help me with the design aspects of the book. And lastly Ron Pihlgren for listening to my ramblings and helping me shape and review the book.
The writing of this books wouldnt have been possible without the help of Bill Jelen as publisher and Jocelyn Collie for the awesome cover design.
Finally I want to thank my family Mom and Dad for getting it all started with that first Commodore 64 :) and of course my beautiful girls: Anouk, Karlijn and Merel for putting up with my crazy passions and moving across the world with me to follow this passion.
Preface
Power Pivot and I were love at first sight, as soon as I installed the first beta of Power Pivot I knew the business intelligence world that I worked in would change forever. When I first installed Power Pivot I was working as a Business Intelligence consultant working on Microsoft SQL Server Analysis Services doing week or month long projects to give insights to large amounts of data to customers. Now with Power Pivot the same insights can be created directly inside Excel without having to be a Business Intelligence professional, being familiar with Excel is enough to create the insights you need. The enthusiasm of the BI professionals and Excel users alike to Power Pivot was incredible. In the years since Power Pivot has been released I have met a lot of customers both as a consultant and being on the Power Pivot team I have seen many scenarios where Power Pivot is very useful.
Notes
This book covers a lot of different topics, written as a story about a user named Jim. Throughout the story, I often dive deeply into various subjects, call out certain areas, and give tips. To do this without deviating from the story, I make heavy use of notes, which fall into seven categories:
- Excel Tip notes
- Power Pivot Tip notes
- Dashboard Tip notes
- Power View Tip notes
- SharePoint Tip notes
- Power BI Tip notes
- General notes
The appendix provides an index of all these notes so you can easily find them at any time.
Hyperlinks
Throughout the book, I reference sites and blog posts for further reading, including my blog, PowerPivotPro; Microsoft online help; and others. Because hyperlinks can be very long, I used a URL-shortening tool for the links I provide. For example, I would present the URL http://ppivot.us/SEUSO instead of the longer http://www.powerpivotblog.nl/project-gemini-building-models-and-analysing-data-from-excel-memory-based-dimensional-model/ . Make sure you pay attention to the capitalization as you type the URLs as they are case-sensitive.
1- About This Book
This book is a little different from most books already out there on Power Pivot. It doesnt cover all the features of Power Pivot, nor does it cover the DAX language extensively. Many books before this one have already done those things well. Two good examples are Bill Jelens PowerPivot for the Data Analyst and Rob Collies DAX Formulas for PowerPivot .
This book is intended as a very practical book to help you get started on a Power Pivot journey that will bring your Excel and data analysis skills to the next level. This book follows Jim, a business user who is very familiar with Excel, on his journey to create a financial dashboard and complementary reports in Microsoft Excel. The journey starts with Jim finding out what information his organization needs in order to understand the current rhythm of its business. He then gathers that information and shapes it into a dashboard, in which he must determine the best ways to visualize information. As you follow Jim on this journey, you will use Power Pivot and DAX formulas to solve several very common business calculations, like year-to-date revenue, variance to target, and year-over-year growth.
You will also learn to create reports in Excel and Microsoft Power View to allow Jims business to dive deeper into the numbers. Then youll see how to share those workbooks to SharePoint and Office 365 Power BI.
In many places, this book dives deeper in subjects like the Power Pivot engine, DAX formulas, and Excel and dashboard design tips and tricks. Most of this book applies to both Excel 2010 and Excel 2013. However, Chapter 5 applies only to Excel 2013 because its about Power View, which is not available in Excel 2010.
I hope you will find this book very useful in creating dashboards that provide insights into data, and Im looking forward to seeing you out there in the Power Pivot community. You can find me at my blog,

