Pagebreaks of the print version

IRON AGE AND ROMAN COIN HOARDS IN BRITAIN
ROGER BLAND, ADRIAN CHADWICK, ELEANOR GHEY, COLIN HASELGROVE, DAVID J. MATTINGLY, ADAM ROGERS AND JEREMY TAYLOR
with
STEWART BRYANT, NICKY GARLAND, SAM MOORHEAD AND KATHERINE ROBBINS
Published in the United Kingdom in 2020 by
OXBOW BOOKS
The Old Music Hall, 106108 Cowley Road, Oxford, OX4 1JE
and in the United States by
OXBOW BOOKS
1950 Lawrence Road, Havertown, PA 19083
Oxbow Books and the individual authors 2020
Hardback Edition: ISBN 978-1-78570-855-8
Digital Edition: ISBN 978-1-78570-856-5 (epub)
ISBN 978-1-78570-857-2 (Mobi)
A CIP record for this book is available from the British Library
Library of Congress Control Number: 2020930089
All rights reserved. No part of this book may be reproduced or transmitted in any form or by any means, electronic or mechanical including photocopying, recording or by any information storage and retrieval system, without permission from the publisher in writing.
For a complete list of Oxbow titles, please contact:
UNITED KINGDOM
Oxbow Books
Telephone (01865) 241249
Email:
www.oxbowbooks.com
UNITED STATES OF AMERICA
Oxbow Books
Telephone (610) 853-9131, Fax (610) 853-9146
Email:
www.casemateacademic.com/oxbow
Oxbow Books is part of the Casemate Group
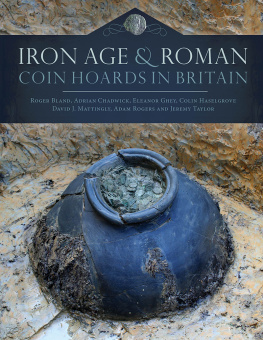
Front cover: The Frome I hoard (photo: Somerset County Council)
List of figures
Fig. 1.1. Distribution of Iron Age and Roman coin hoards from Britain and Ireland.
Fig. 1.2. The English Government regions and Wales.
Fig. 2.1. Recorded method of discovery for hoards by decade.
Fig. 2.2. The overall distribution of hoards by (including Iron Age hoards in RP 1).
Fig. 2.3. The overall distribution of Roman hoards by RP.
Fig. 2.4. Numbers of Roman hoards per mill. by RP compared with per mill. figures for British single coins and site finds calculated by Walton (2012).
Fig. 2.5. Percentage breakdown of hoards by region (RP 17).
Fig. 2.6. Percentage breakdown of hoards by region (RP 815).
Fig. 2.7. Percentage breakdown of hoards by region (RP 1622).
Fig. 2.8. Distribution of Iron Age and Roman coin hoards and Roman coinage from RP 1 (before AD 41).
Fig. 2.9. Distribution of Roman coin hoards and Roman coinage from RP 1 (before AD 41).
Fig. 2.10. Distribution of hoards and all coinage from RP 2 (AD 4154).
Fig. 2.11. Distribution of hoards and all coinage from RP 3 (AD 5468).
Fig. 2.12. Distribution of hoards and all coinage from RP 4 (AD 6996).
Fig. 2.13. Distribution of hoards and all coinage from RP 5 (AD 96117).
Fig. 2.14. Distribution of hoards and all coinage from RP 6 (AD 117138).
Fig. 2.15. Distribution of hoards and all coinage from RP 7 (AD 138161).
Fig. 2.16. Distribution of hoards and all coinage from RP 8 (AD 161180).
Fig. 2.17. Distribution of hoards and all coinage from RP 9 (AD 180192).
Fig. 2.18. Distribution of hoards and all coinage from RP 10 (AD 193222).
Fig. 2.19. Distribution of hoards and all coinage from RP 11 (AD 222238).
Fig. 2.20. Distribution of hoards and all coinage from RP 12 (AD 238260).
Fig. 2.21. Distribution of hoards and all coinage from RP 13 (AD 260275).
Fig. 2.22. Distribution of hoards and all coinage from RP 14 (AD 275296).
Fig. 2.23. Distribution of hoards and all coinage from RP 15 (AD 296317).
Fig. 2.24. Distribution of hoards and all coinage from RP 16 (AD 317330).
Fig. 2.25. Distribution of hoards and all coinage from RP 17 (AD 330348).
Fig. 2.26. Distribution of hoards and all coinage from RP 18 (AD 348364).
Fig. 2.27. Distribution of hoards and all coinage from RP 19 (AD 364378).
Fig. 2.28. Distribution of hoards and all coinage from RP 20 (AD 378388).
Fig. 2.29. Distribution of hoards and all coinage from RP 21 (AD 388402).
Fig. 2.30. Distribution of hoards and all coinage from RP 22 (AD 402445).
Fig. 2.31. Average size of coin hoards in England and Wales, with Scotland and Ireland for comparison.
Fig. 2.32. Average number of coins in hoards by RP.
Fig. 2.33. Number of hoards containing coins of four metals by region, with Scotland and Ireland for comparison.
Fig. 2.34. Total number of coins of four metals in hoards by region, with Scotland and Ireland for comparison.
Fig. 2.35. Average number of denarii in hoards containing denarii by region.
Fig. 2.36. Average number of denarii in hoards containing denarii by RP.
Fig. 2.37. Average number of sestertii and lower denominations in hoards containing these denominations by region.
Fig. 2.38. Average number of sestertii and lower denominations in hoards containing these denominations by RP.
Fig. 2.39. Average number of radiates in hoards containing radiates by region.
Fig. 2.40. Average number of radiates in hoards containing radiates by RP.
Fig. 2.41. Average number of nummi in hoards by region.
Fig. 2.42. Average number of nummi in hoards by RP.
Fig. 4.1. Scheduled ancient monuments.
Fig. 4.2. Built-up areas.
Fig. 4.3. National Trust land.
Fig. 4.4. Access land.
Fig. 4.5. Sites of Special Scientific Interest.
Fig. 4.6. Forestry Commission land.
Fig. 4.7. Upland areas.
Fig. 4.8. Map showing Government/PAS regions and the IARCH study areas.
Fig. 4.9. Proportion of hoards at different elevations against national DEM.
Fig. 4.10. Hoards against elevation in the North West, North East, East Midlands and West Midlands.
Fig. 4.11. Hoards against elevation in the East, South East, South West, Yorkshire and the Humber and Wales.
Fig. 4.12. Hoard proportions by slope nationally.
Fig. 4.13. Hoards and slope in the North West, North East, East Midlands and West Midlands.
Fig. 4.14. Hoards and slope in the East, South East, South West, Yorkshire and the Humber and Wales.
Fig. 4.15. Hoards and aspect nationally.
Fig. 4.16. Hoards and aspect in the North West, North East, East Midlands and West Midlands.
Fig. 4.17. Hoards and aspect in the East, South East, South West, Yorkshire and the Humber and Wales.
Fig. 4.18. Hoards and rivers nationally.
Fig. 4.19. Hoards and rivers in the North West, North East, East Midlands and West Midlands.
Fig. 4.20. Hoards and rivers in the East, South East, South West, Yorkshire and the Humber and Wales.
Fig. 4.21. Association of hoarding with forts through time.
Fig. 4.22. Proximity of hoards to forts by RP.
Fig. 4.23. Hoards and forts, RP 12.
Fig. 4.24. Hoards and forts, RP 36.
Fig. 4.25. Hoards and forts, RP 711.
Fig. 4.26. Hoards and forts, RP 1214.
Fig. 4.27. Hoards and forts, RP 1518.
Fig. 4.28. Hoards and forts, RP 1923.
Fig. 4.29. Association of hoarding with temples/shrines through time.
Fig. 4.30. Proximity of hoards to temples/shrines by RP.
Fig. 4.31. Hoards and temples, RP 12.
Fig. 4.32. Hoards and temples, RP 36.
Fig. 4.33. Hoards and temples, RP 711.
Fig. 4.34. Hoards and temples, RP 1214.
Fig. 4.35. Hoards and temples, RP 1518.
Fig. 4.36. Hoards and temples, RP 1923.
Fig. 4.37. Association of hoarding with major towns by region.
Fig. 4.38. Association of hoarding with major towns through time.
Fig. 4.39. Proximity of hoards to major towns by RP.

