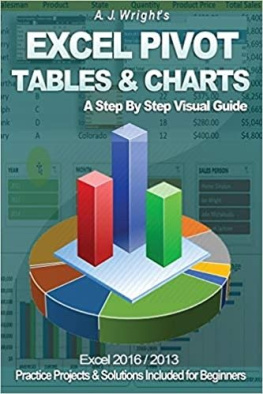
ALISHA - 50 Things You Can Do With Excel Pivot Table
Here you can read online ALISHA - 50 Things You Can Do With Excel Pivot Table full text of the book (entire story) in english for free. Download pdf and epub, get meaning, cover and reviews about this ebook. year: 2020, genre: Home and family. Description of the work, (preface) as well as reviews are available. Best literature library LitArk.com created for fans of good reading and offers a wide selection of genres:
Romance novel
Science fiction
Adventure
Detective
Science
History
Home and family
Prose
Art
Politics
Computer
Non-fiction
Religion
Business
Children
Humor
Choose a favorite category and find really read worthwhile books. Enjoy immersion in the world of imagination, feel the emotions of the characters or learn something new for yourself, make an fascinating discovery.

- Book:50 Things You Can Do With Excel Pivot Table
- Author:
- Genre:
- Year:2020
- Rating:5 / 5
- Favourites:Add to favourites
- Your mark:
50 Things You Can Do With Excel Pivot Table: summary, description and annotation
We offer to read an annotation, description, summary or preface (depends on what the author of the book "50 Things You Can Do With Excel Pivot Table" wrote himself). If you haven't found the necessary information about the book — write in the comments, we will try to find it.
ALISHA: author's other books
Who wrote 50 Things You Can Do With Excel Pivot Table? Find out the surname, the name of the author of the book and a list of all author's works by series.
50 Things You Can Do With Excel Pivot Table — read online for free the complete book (whole text) full work
Below is the text of the book, divided by pages. System saving the place of the last page read, allows you to conveniently read the book "50 Things You Can Do With Excel Pivot Table" online for free, without having to search again every time where you left off. Put a bookmark, and you can go to the page where you finished reading at any time.
Font size:
Interval:
Bookmark:
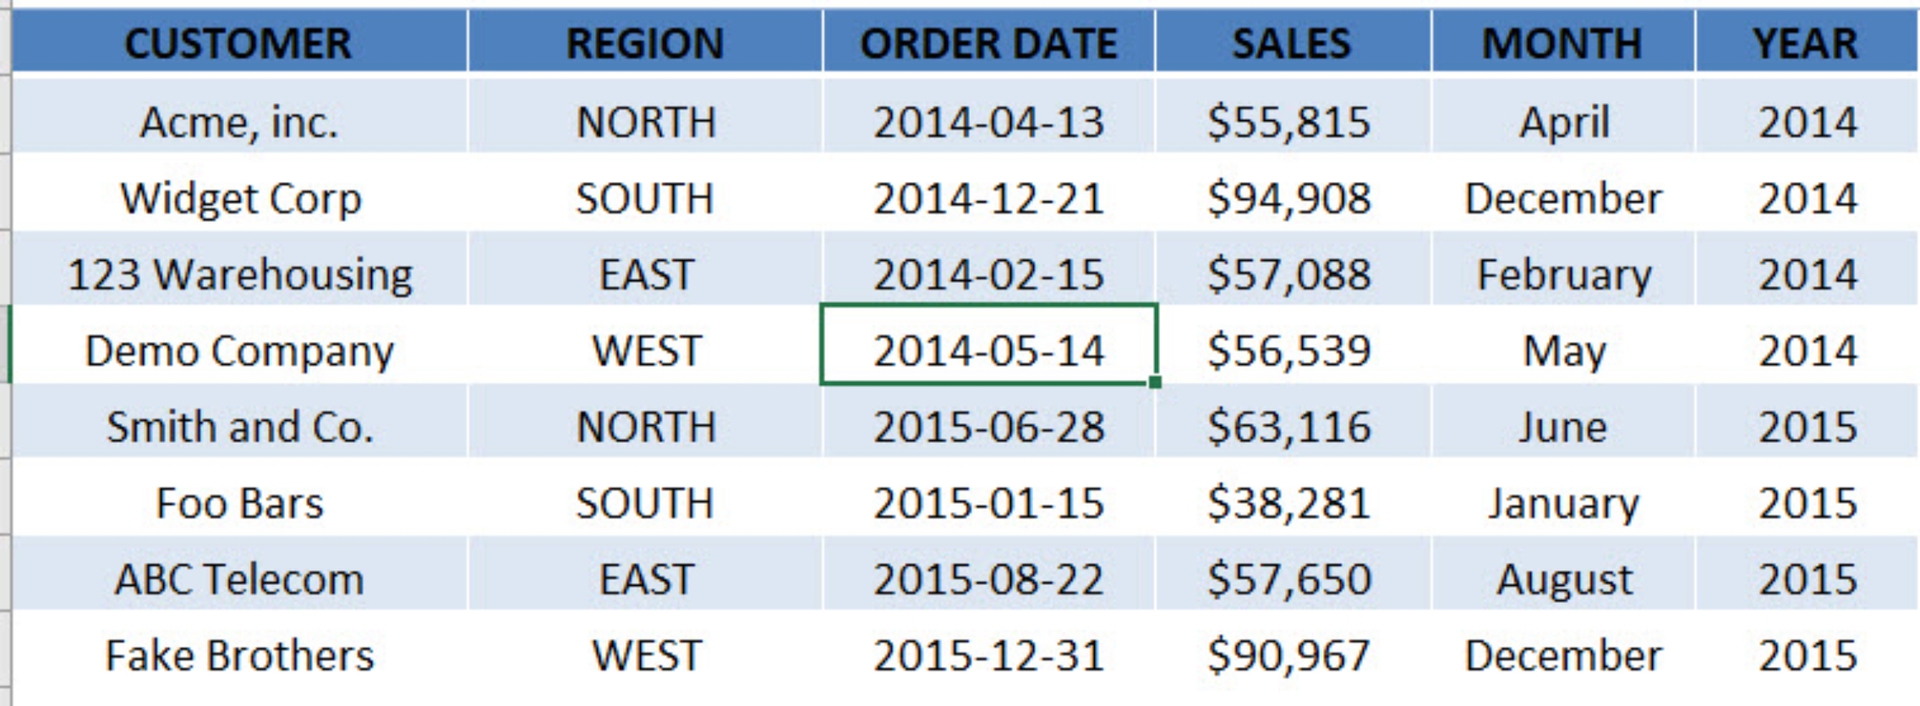
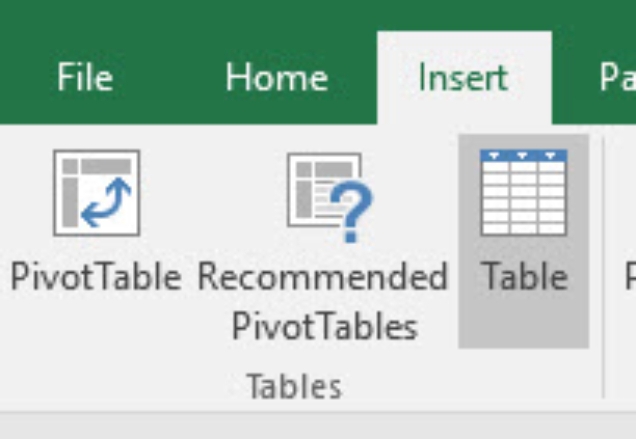
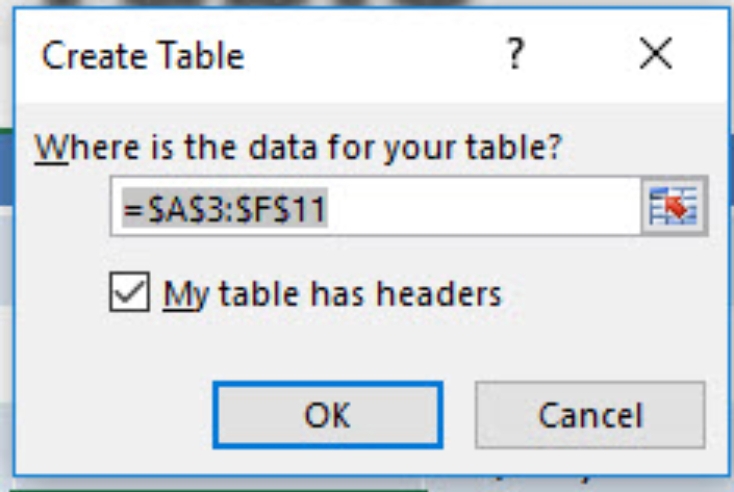
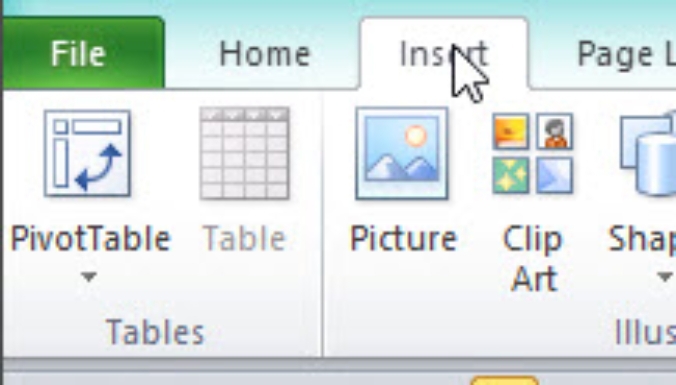
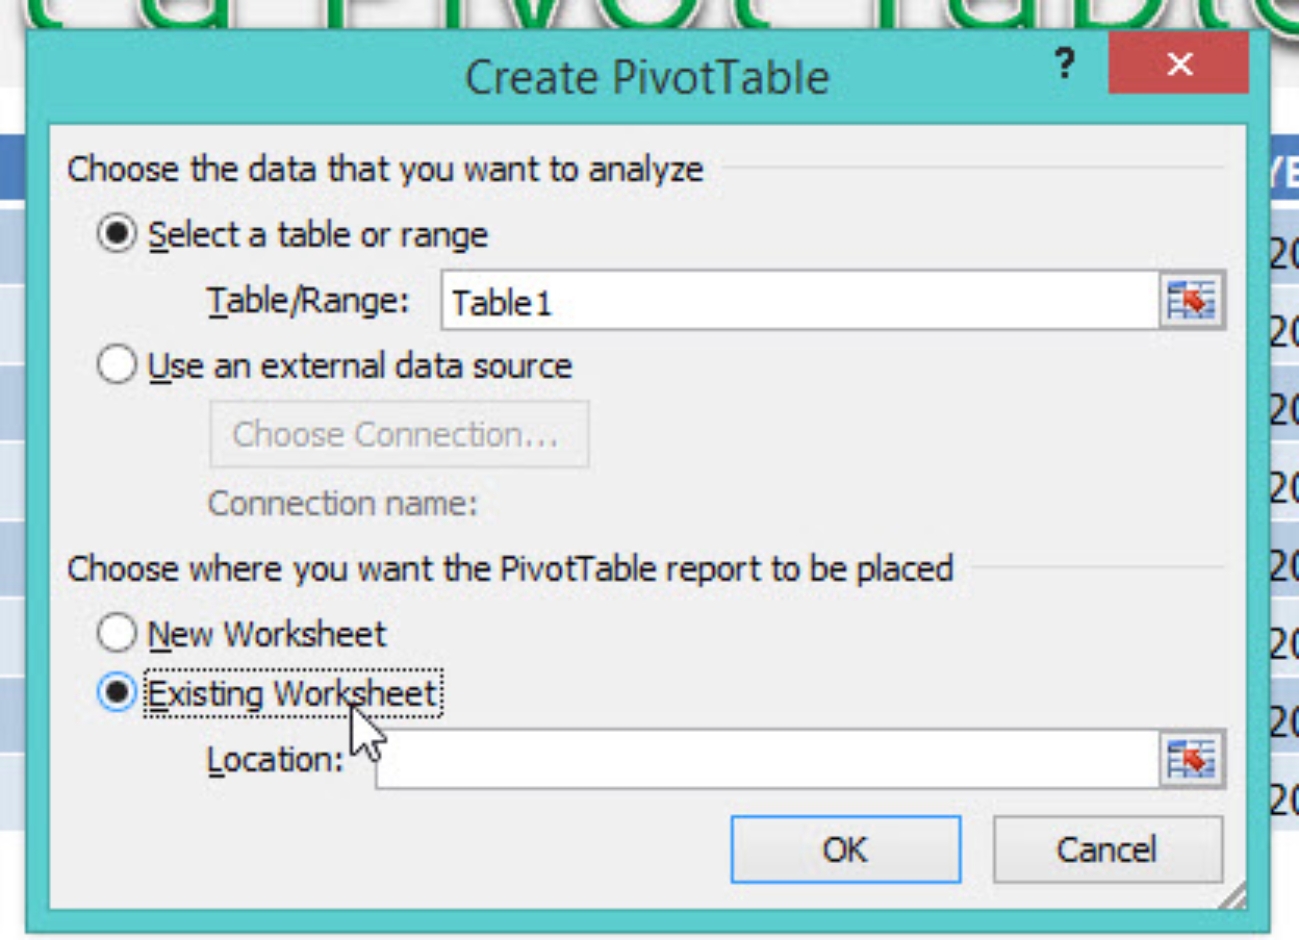
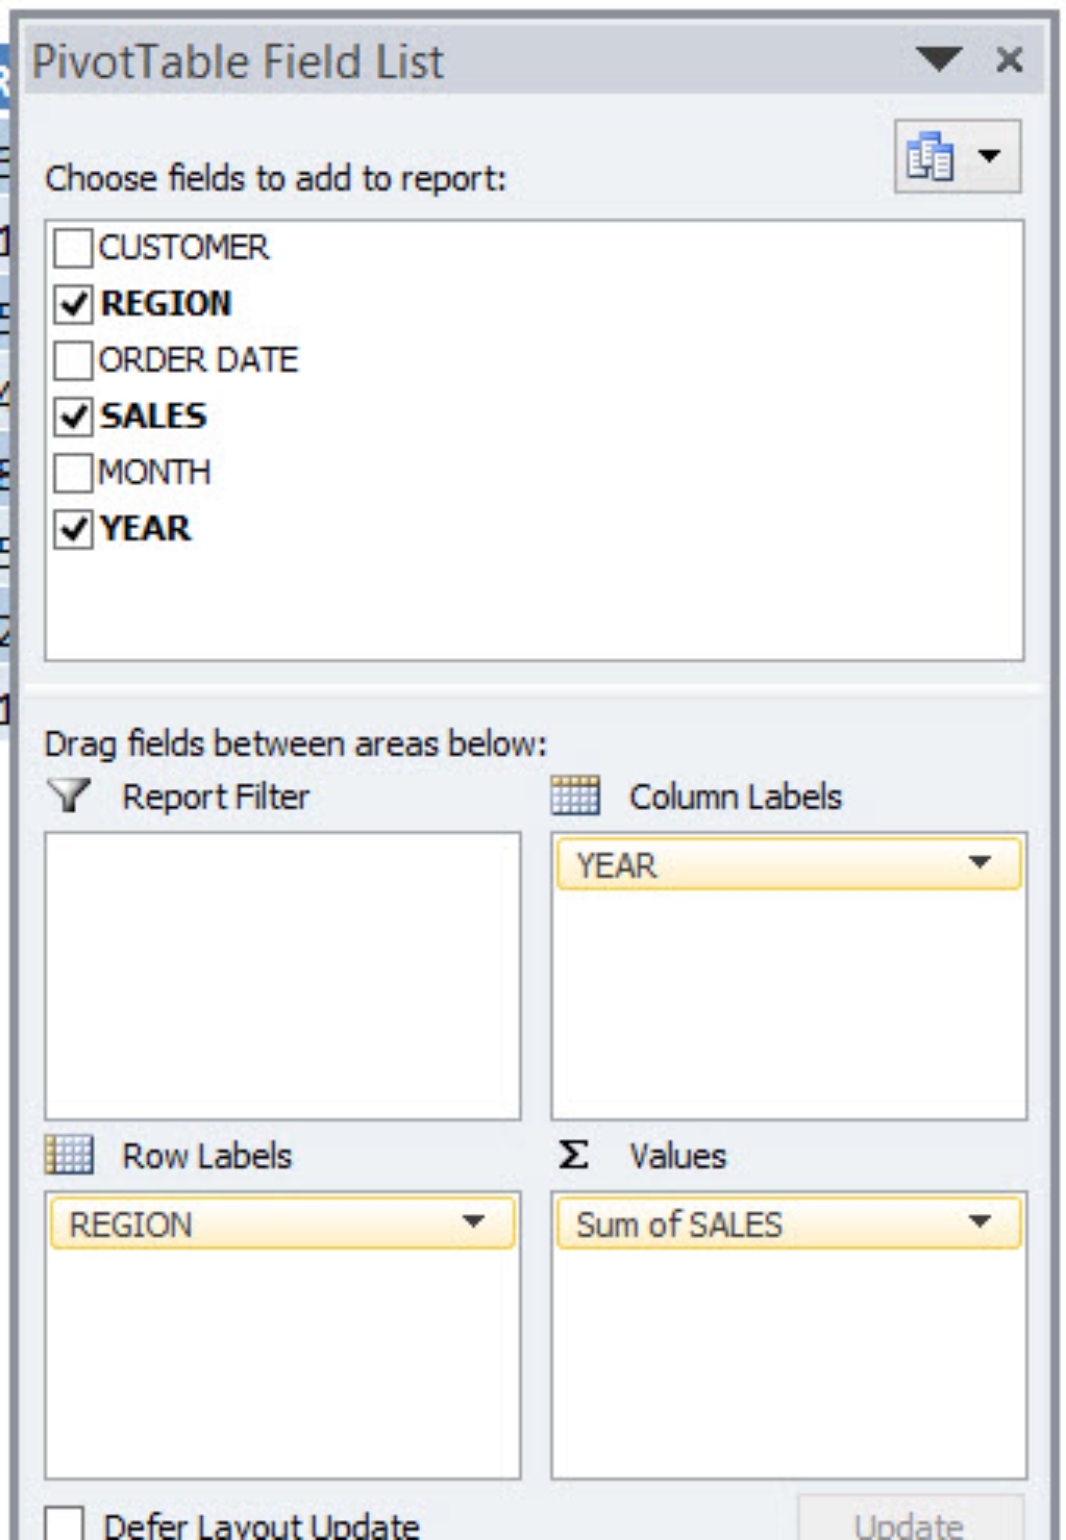
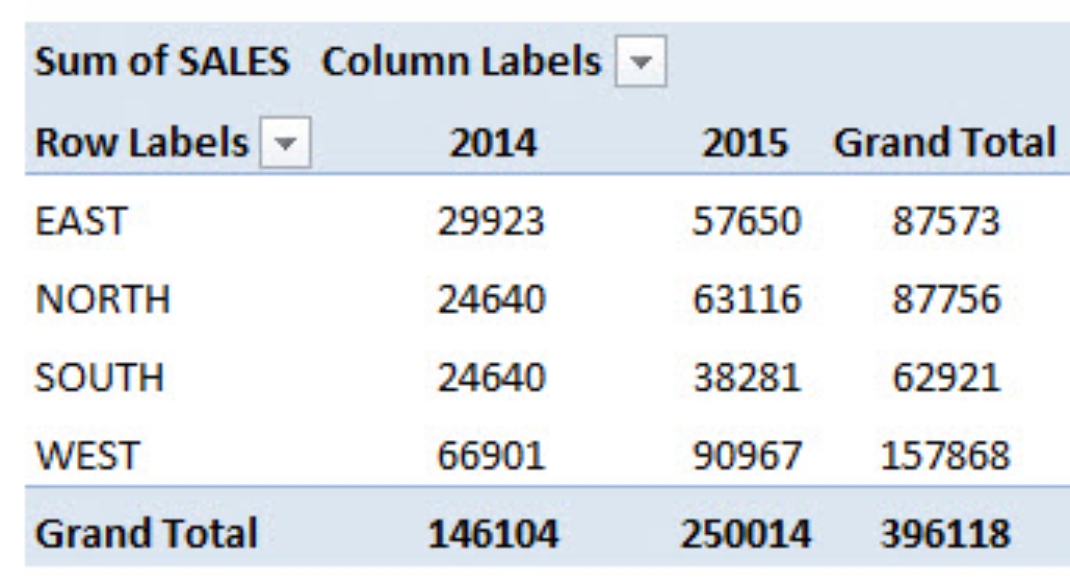
Topic 2: Inserting a Pivot Table
Topic 3: Drill down to audit
Topic 4: Refresh
Topic 5: Subtotals
Topic 6: Report Layouts
Topic 7: Change Count of to Sum of
Topic 8: Number formatting
Topic 9: Format error values
Topic 10: Format empty cells
Topic 11: Keep column widths upon refresh
Topic 12: Show report filter on multiple pages
Topic 13: Average
Topic 14: Show a unique count
Topic 15: % of Grand Total
Topic 16: % of Column Total
Topic 17: % of Row Total
Topic 18: Difference From
Topic 19: Running Total in
Topic 20: Group by Date
Topic 21: Group by Quarters & Years
Topic 22: Sorting by Largest or Smallest
Topic 23: Sort using a Custom List
Topic 24: Filter by Dates
Topic 25: Filter by Values Top 5 Items
Topic 27: Slicer Styles
Topic 28: Slicer Connections for multiple pivot tables
Topic 29: Different ways to filter a Slicer
Topic 30: Creating a Calculated Field
Topic 31: Creating a Calculated Item
Topic 32: Insert a Pivot Chart
Topic 33: Pivot Chart & Slicers
Topic 34: Highlight Cell Rules based on values
Topic 35: Directional Icons
Topic 36: Data Bars, Color Scales & Icon Sets
Topic 37: Intro to GETPIVOTDATA
Topic 38: Refresh All
Topic 39: Move a Pivot Table
Topic 40: Show/Hide Field List
Topic 41: Pivot Table Styles
Topic 42: Sort manually
Topic 43: Use an External Data Source
Topic 44: Clear and Delete Old Items
Topic 45: Count VS Sum
Topic 46: Automatically Refresh
Topic 47: Frequency Distribution
Topic 48: Slicer Connection Greyed Out
Topic 49: Filter by Values (Soon)
Topic 50: Filter by Text wildcards * and ? (Soon)
BONUS: FREE EXCEL PIVOT TABLE WEBINAR
FREE EXCEL GUIDES

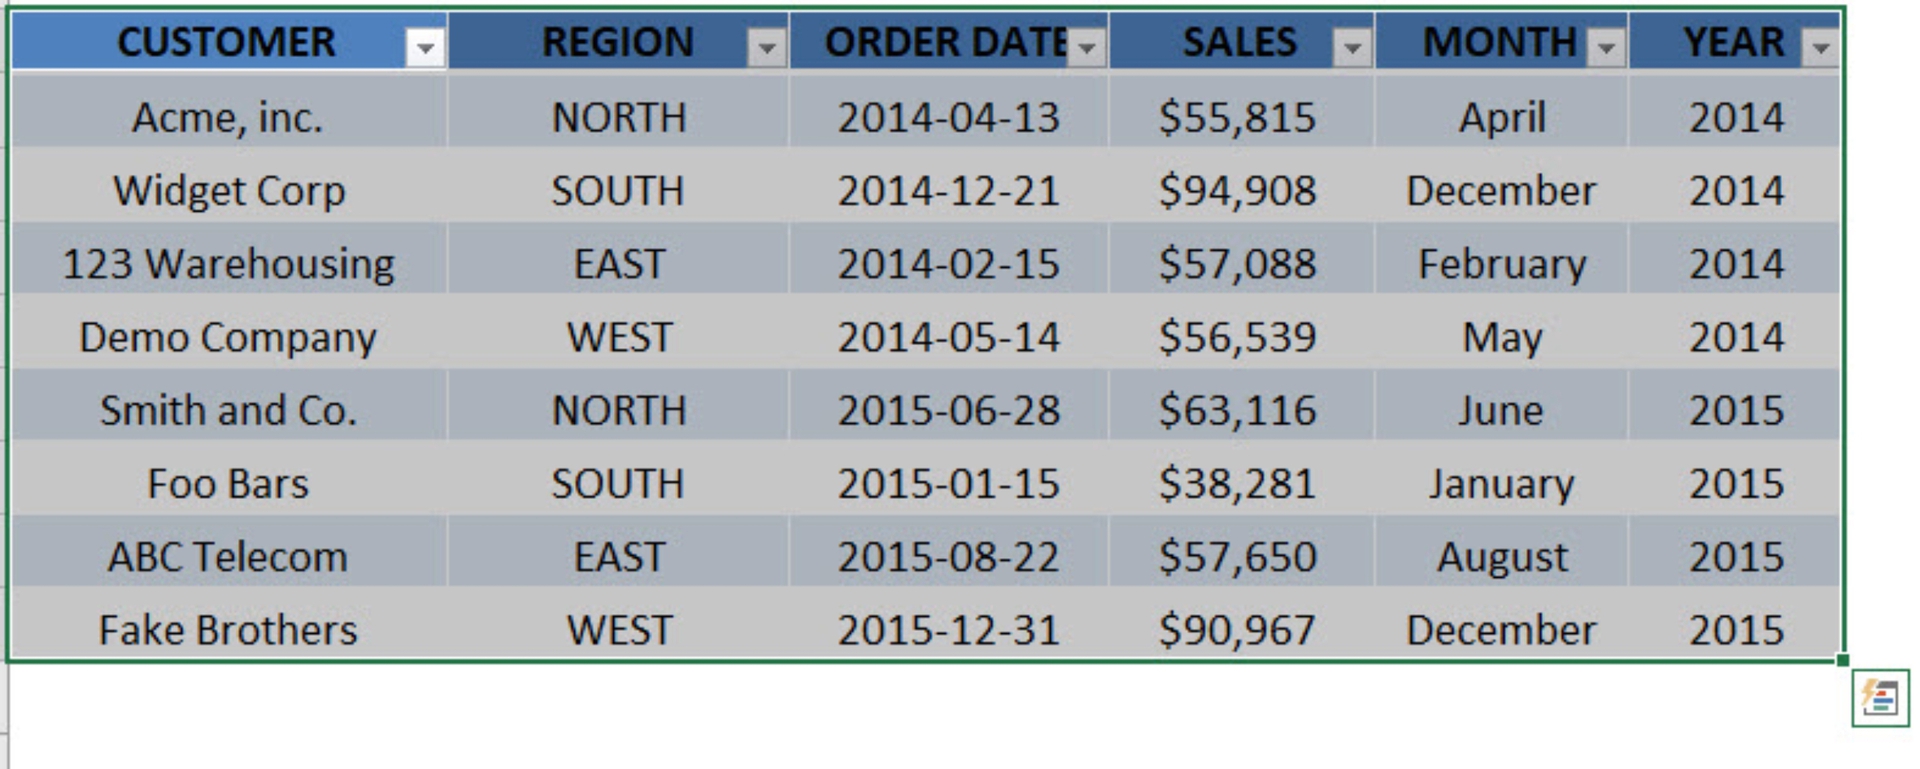
2. Many different built-in Table Styles with color formatting;
3. Use of a Total Row which uses built-in functions to calculate the contents of a particular column;
4. Dropdown lists that allow you to Sort & Filter;
5. When you scroll down from the Table, its Headers replace the Column Letters in the worksheet;
6. Remove Duplicate Rows automatically;
7. Summarize the Table with a Pivot Table;
8. Supports calculated Columns so you can create dynamic formulas outside the Table;
Font size:
Interval:
Bookmark:
Similar books «50 Things You Can Do With Excel Pivot Table»
Look at similar books to 50 Things You Can Do With Excel Pivot Table. We have selected literature similar in name and meaning in the hope of providing readers with more options to find new, interesting, not yet read works.
Discussion, reviews of the book 50 Things You Can Do With Excel Pivot Table and just readers' own opinions. Leave your comments, write what you think about the work, its meaning or the main characters. Specify what exactly you liked and what you didn't like, and why you think so.